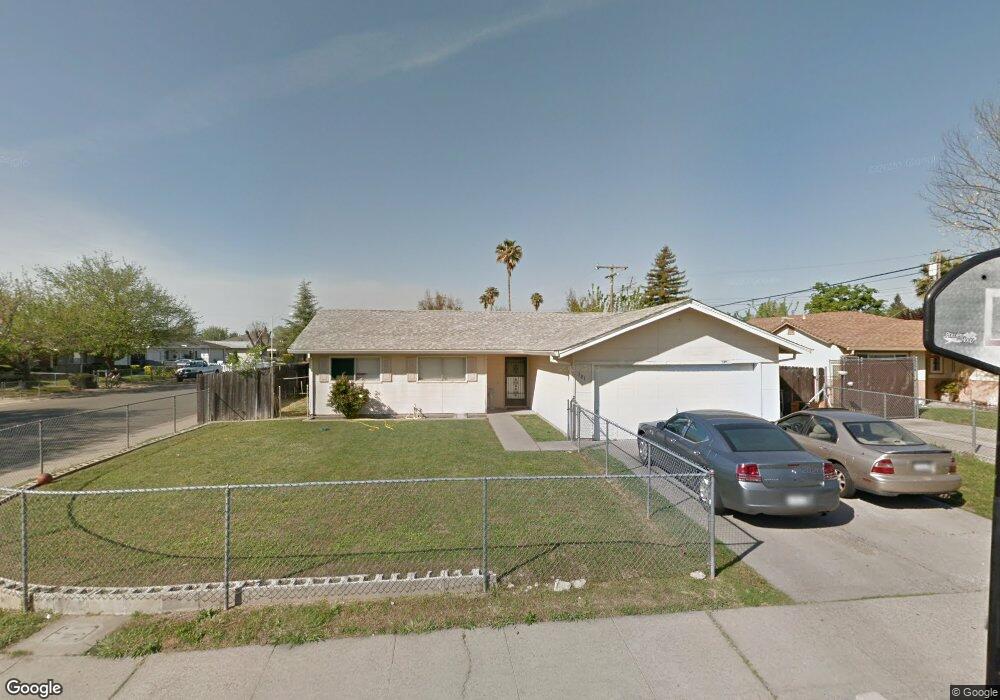
301 Yampa Cir Sacramento, CA 95838
Glenwood Meadows NeighborhoodEstimated Value: $163,000 - $419,000
3
Beds
2
Baths
1,062
Sq Ft
$317/Sq Ft
Est. Value
About This Home
This home is located at 301 Yampa Cir, Sacramento, CA 95838 and is currently estimated at $336,303, approximately $316 per square foot. 301 Yampa Cir is a home located in Sacramento County with nearby schools including Glenwood Elementary School, Rio Linda Preparatory Academy, and Norwood Junior High School.
Ownership History
Date
Name
Owned For
Owner Type
Purchase Details
Closed on
Sep 19, 2023
Sold by
Office Marlowe and Juanita Stallworth W
Bought by
Marlowe M Office Family Trust and Office
Current Estimated Value
Purchase Details
Closed on
Dec 20, 2019
Sold by
Office Marlowe
Bought by
Office Marlowe and Stallworth Wjuanita
Purchase Details
Closed on
Feb 27, 2019
Sold by
Justice Stephen R
Bought by
Office Marlowe M
Home Financials for this Owner
Home Financials are based on the most recent Mortgage that was taken out on this home.
Original Mortgage
$93,000
Interest Rate
3.4%
Mortgage Type
New Conventional
Purchase Details
Closed on
Jun 11, 2008
Sold by
Emc Mortgage Corp
Bought by
Office Marlowe M
Home Financials for this Owner
Home Financials are based on the most recent Mortgage that was taken out on this home.
Original Mortgage
$88,000
Interest Rate
5.99%
Mortgage Type
Purchase Money Mortgage
Purchase Details
Closed on
Oct 2, 2007
Sold by
Reveles Alex
Bought by
Emc Mortgage Corp
Purchase Details
Closed on
Apr 24, 2003
Sold by
Reveles Alex and Shelton Mark A
Bought by
Reveles Alex
Home Financials for this Owner
Home Financials are based on the most recent Mortgage that was taken out on this home.
Original Mortgage
$162,639
Interest Rate
5.84%
Mortgage Type
FHA
Purchase Details
Closed on
May 1, 2002
Sold by
Reveles Angela
Bought by
Reveles Alex
Home Financials for this Owner
Home Financials are based on the most recent Mortgage that was taken out on this home.
Original Mortgage
$160,236
Interest Rate
7.13%
Mortgage Type
FHA
Purchase Details
Closed on
Apr 30, 2002
Sold by
Canchola John
Bought by
Reveles Alex and Shelton Mark A
Home Financials for this Owner
Home Financials are based on the most recent Mortgage that was taken out on this home.
Original Mortgage
$160,236
Interest Rate
7.13%
Mortgage Type
FHA
Purchase Details
Closed on
Jan 2, 2002
Sold by
Downie Martin A
Bought by
Canchola John
Home Financials for this Owner
Home Financials are based on the most recent Mortgage that was taken out on this home.
Original Mortgage
$86,500
Interest Rate
7.01%
Purchase Details
Closed on
Nov 2, 1998
Sold by
Va
Bought by
Downie Martin A
Home Financials for this Owner
Home Financials are based on the most recent Mortgage that was taken out on this home.
Original Mortgage
$60,000
Interest Rate
8.99%
Create a Home Valuation Report for This Property
The Home Valuation Report is an in-depth analysis detailing your home's value as well as a comparison with similar homes in the area
Home Values in the Area
Average Home Value in this Area
Purchase History
| Date | Buyer | Sale Price | Title Company |
|---|---|---|---|
| Marlowe M Office Family Trust | -- | None Listed On Document | |
| Marlowe M Office Family Trust | -- | None Listed On Document | |
| Office Marlowe | -- | None Available | |
| Office Marlowe M | -- | First American Title Ins Co | |
| Office Marlowe M | -- | First American Title Ins Co | |
| Office Marlowe M | $110,000 | First American Title | |
| Emc Mortgage Corp | $220,150 | Accommodation | |
| Reveles Alex | -- | -- | |
| Reveles Alex | -- | First American Title Guarant | |
| Reveles Alex | $162,500 | First American Title Guarant | |
| Canchola John | $60,000 | Chicago Title Co | |
| Downie Martin A | -- | -- |
Source: Public Records
Mortgage History
| Date | Status | Borrower | Loan Amount |
|---|---|---|---|
| Previous Owner | Office Marlowe M | $93,000 | |
| Previous Owner | Office Marlowe M | $88,000 | |
| Previous Owner | Reveles Alex | $162,639 | |
| Previous Owner | Reveles Alex | $160,236 | |
| Previous Owner | Canchola John | $86,500 | |
| Previous Owner | Downie Martin A | $60,000 |
Source: Public Records
Tax History Compared to Growth
Tax History
| Year | Tax Paid | Tax Assessment Tax Assessment Total Assessment is a certain percentage of the fair market value that is determined by local assessors to be the total taxable value of land and additions on the property. | Land | Improvement |
|---|---|---|---|---|
| 2025 | $1,995 | $144,471 | $65,669 | $78,802 |
| 2024 | $1,995 | $141,639 | $64,382 | $77,257 |
| 2023 | $2,056 | $138,863 | $63,120 | $75,743 |
| 2022 | $1,946 | $136,141 | $61,883 | $74,258 |
| 2021 | $1,944 | $133,472 | $60,670 | $72,802 |
| 2020 | $1,907 | $132,104 | $60,048 | $72,056 |
| 2019 | $1,899 | $129,515 | $58,871 | $70,644 |
| 2018 | $1,766 | $126,976 | $57,717 | $69,259 |
| 2017 | $2,311 | $124,487 | $56,586 | $67,901 |
| 2016 | $1,733 | $122,047 | $55,477 | $66,570 |
| 2015 | $2,924 | $120,215 | $54,644 | $65,571 |
| 2014 | $2,406 | $117,861 | $53,574 | $64,287 |
Source: Public Records
Map
Nearby Homes
- 335 Jessie Ave
- 328 Las Animas Cir
- 230 Du Bois Ave
- 173 Bell Ave
- 400 Berthoud St
- 2 Keely Ct
- 541 Samuel Way
- 568 Samuel Way
- 4550 Norwood Ave
- 1 Butterwick Ct
- 3940 Norwood Ave
- 131 Mcdaniel Cir
- 4561 Tidewind Dr
- 204 Arbor Crest Way
- 4482 Windcloud Ave
- 661 Tailwind Dr
- 3815 Lee Brook Way
- Plan 7 at Valley Vista
- Plan 3 at Valley Vista
- Plan 7 at Valley Vista