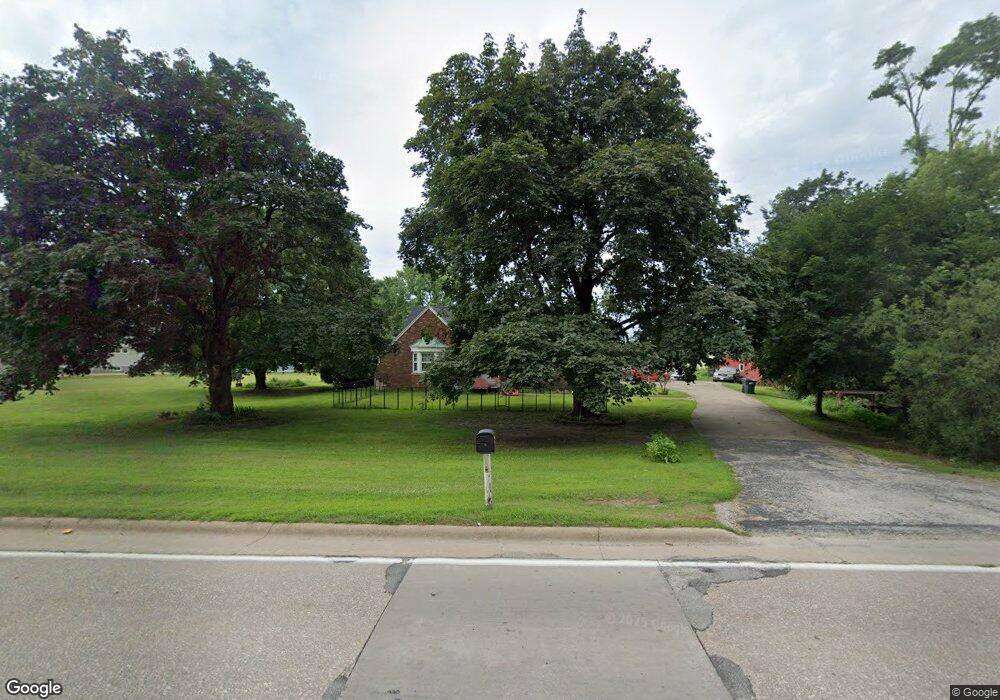
3010 38th Ave Moline, IL 61265
Prospect Park NeighborhoodEstimated Value: $257,000 - $350,000
3
Beds
2
Baths
1,832
Sq Ft
$166/Sq Ft
Est. Value
About This Home
This home is located at 3010 38th Ave, Moline, IL 61265 and is currently estimated at $304,647, approximately $166 per square foot. 3010 38th Ave is a home located in Rock Island County with nearby schools including Hamilton Elementary School, John Deere Middle School, and Moline Sr High School.
Ownership History
Date
Name
Owned For
Owner Type
Purchase Details
Closed on
Mar 7, 2025
Sold by
Rowe Lieschen Leanne and Rowe Kaylie Lieschen
Bought by
Robinson Sarah
Current Estimated Value
Home Financials for this Owner
Home Financials are based on the most recent Mortgage that was taken out on this home.
Original Mortgage
$284,999
Outstanding Balance
$282,900
Interest Rate
7.13%
Mortgage Type
New Conventional
Estimated Equity
$21,747
Purchase Details
Closed on
Oct 5, 2021
Sold by
Findlay Clifford W and Findlay Della T
Bought by
Rowe Lieschen Leanne and Rowe Ryan L
Home Financials for this Owner
Home Financials are based on the most recent Mortgage that was taken out on this home.
Original Mortgage
$152,500
Interest Rate
2.75%
Mortgage Type
VA
Purchase Details
Closed on
Feb 27, 2018
Sold by
Findlay Clifford W and Findlay Della I
Bought by
Findlay Clifford W and Findlay Della I
Create a Home Valuation Report for This Property
The Home Valuation Report is an in-depth analysis detailing your home's value as well as a comparison with similar homes in the area
Home Values in the Area
Average Home Value in this Area
Purchase History
| Date | Buyer | Sale Price | Title Company |
|---|---|---|---|
| Robinson Sarah | $299,999 | Gomez Title | |
| Rowe Lieschen Leanne | $152,500 | Gomez May Llp | |
| Findlay Clifford W | -- | Schnell & Hancock Pc |
Source: Public Records
Mortgage History
| Date | Status | Borrower | Loan Amount |
|---|---|---|---|
| Open | Robinson Sarah | $284,999 | |
| Previous Owner | Rowe Lieschen Leanne | $152,500 |
Source: Public Records
Tax History
| Year | Tax Paid | Tax Assessment Tax Assessment Total Assessment is a certain percentage of the fair market value that is determined by local assessors to be the total taxable value of land and additions on the property. | Land | Improvement |
|---|---|---|---|---|
| 2024 | $2,962 | $51,514 | $16,570 | $34,944 |
| 2023 | $2,962 | $47,435 | $15,258 | $32,177 |
| 2022 | $1,301 | $45,523 | $14,643 | $30,880 |
| 2021 | $1,301 | $43,521 | $13,999 | $29,522 |
| 2020 | $1,851 | $42,794 | $13,765 | $29,029 |
| 2019 | $1,833 | $42,120 | $13,548 | $28,572 |
| 2018 | $1,833 | $41,486 | $13,344 | $28,142 |
| 2017 | $1,824 | $40,833 | $13,134 | $27,699 |
| 2016 | $1,838 | $39,567 | $12,727 | $26,840 |
| 2015 | $1,840 | $38,669 | $12,438 | $26,231 |
| 2014 | $527 | $39,055 | $12,562 | $26,493 |
| 2013 | $527 | $39,055 | $12,562 | $26,493 |
Source: Public Records
Map
Nearby Homes
- 0 38th Unit MRDQC4269332
- Lot 59 36th Ave
- 3510 35th St
- 3721 35th St Unit 1
- 3721 35th St Unit 4
- 3717 35th St Unit 1
- 3715 35th St Unit 4
- 3715 35th St Unit 3
- 3440 38th Ave
- 3705 35th St
- 3515 44th Ave
- 2610 31st St
- 3604 32nd Ave
- 3332 16th St
- 3818 15th Street C
- 3808 15th Street B
- 1587 34th Ave
- 6101-6115-6129 34th Ave
- 3820 15th St
- 1511 36th Ave
Your Personal Tour Guide
Ask me questions while you tour the home.