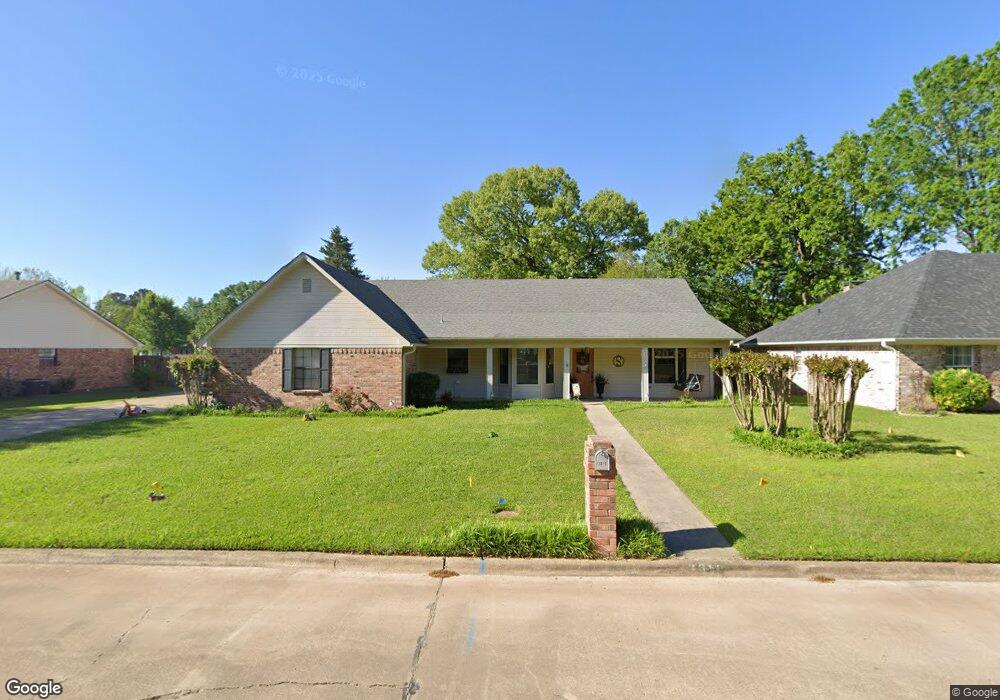
3010 Bethany Ln Texarkana, TX 75503
Estimated Value: $240,653 - $297,000
--
Bed
--
Bath
1,830
Sq Ft
$148/Sq Ft
Est. Value
About This Home
This home is located at 3010 Bethany Ln, Texarkana, TX 75503 and is currently estimated at $270,163, approximately $147 per square foot. 3010 Bethany Ln is a home located in Bowie County with nearby schools including Margaret Fischer Davis Elementary School, Pleasant Grove Intermediate School, and Pleasant Grove Middle School.
Ownership History
Date
Name
Owned For
Owner Type
Purchase Details
Closed on
Aug 31, 2016
Sold by
Luckey Michael S and Luckey Sarah J
Bought by
Sharp Carolyn R
Current Estimated Value
Home Financials for this Owner
Home Financials are based on the most recent Mortgage that was taken out on this home.
Original Mortgage
$63,000
Outstanding Balance
$28,788
Interest Rate
3.45%
Estimated Equity
$241,375
Purchase Details
Closed on
Jun 27, 2012
Sold by
Bugh Gary E
Bought by
Luckey Michael S
Home Financials for this Owner
Home Financials are based on the most recent Mortgage that was taken out on this home.
Original Mortgage
$144,000
Interest Rate
3.8%
Purchase Details
Closed on
Jul 22, 2011
Sold by
Morris Jerry N and Morris Phyllis E
Bought by
Bugh Gary E
Home Financials for this Owner
Home Financials are based on the most recent Mortgage that was taken out on this home.
Original Mortgage
$151,050
Interest Rate
4.53%
Create a Home Valuation Report for This Property
The Home Valuation Report is an in-depth analysis detailing your home's value as well as a comparison with similar homes in the area
Home Values in the Area
Average Home Value in this Area
Purchase History
| Date | Buyer | Sale Price | Title Company |
|---|---|---|---|
| Sharp Carolyn R | -- | Twin City Title Company | |
| Luckey Michael S | -- | Stewart Title Of Texarkana | |
| Bugh Gary E | -- | Stewart Title Of Texasrkana |
Source: Public Records
Mortgage History
| Date | Status | Borrower | Loan Amount |
|---|---|---|---|
| Open | Sharp Carolyn R | $63,000 | |
| Previous Owner | Luckey Michael S | $144,000 | |
| Previous Owner | Bugh Gary E | $151,050 |
Source: Public Records
Tax History Compared to Growth
Tax History
| Year | Tax Paid | Tax Assessment Tax Assessment Total Assessment is a certain percentage of the fair market value that is determined by local assessors to be the total taxable value of land and additions on the property. | Land | Improvement |
|---|---|---|---|---|
| 2025 | $3,653 | $227,298 | $25,000 | $202,298 |
| 2024 | $3,653 | $219,966 | $25,000 | $201,630 |
| 2023 | $4,502 | $199,969 | $0 | $0 |
| 2022 | $4,464 | $196,768 | $25,000 | $171,768 |
| 2021 | $4,322 | $165,264 | $22,000 | $143,264 |
| 2020 | $4,176 | $158,868 | $22,000 | $136,868 |
| 2019 | $4,121 | $152,777 | $22,000 | $130,777 |
| 2018 | $4,013 | $149,593 | $22,000 | $127,593 |
| 2017 | $3,940 | $147,272 | $22,000 | $125,272 |
| 2016 | $3,849 | $143,888 | $22,000 | $121,888 |
| 2015 | $3,844 | $144,119 | $22,000 | $122,119 |
| 2014 | $3,844 | $142,998 | $22,000 | $120,998 |
Source: Public Records
Map
Nearby Homes
- 3004 Bethany Ln
- 3007 Bethany Ln
- 3105 Bethany Ln
- 2905 Landon Ln
- 3104 Bethany Ln
- 3108 Bethany Ln
- 5904 Cooks Ln
- 6106 Ben Burrough Rd
- 6107 Ben Burrough Rd
- 3003 Kevin Ave
- 6009 Beacon Hill Dr
- 5812 Cooks Ln
- 5810 Cooks Ln
- 5808 Cooks Ln
- 3108 Crestridge Dr
- 6210 Gould Place
- 3103 Crestridge Dr
- 6131 Summerhill Place
- 6137 Summerhill Place
- 2 Whitney Cir
- 3008 Bethany Ln
- 3012 Bethany Ln
- 3009 Brittney Ln
- 3007 Brittney Ln
- 3011 Brittney Ln
- 3006 Bethany Ln
- 3009 Bethany Ln
- 3005 Brittney Ln
- 3011 Bethany Ln
- 3100 Bethany Ln
- 3005 Bethany Ln
- 6219 Veronica Ln
- 3101 Brittney Ln
- 3008 Brittney Ln
- 3003 Brittney Ln
- 3006 Brittney Ln
- 3010 Brittney Ln
- 3003 Bethany Ln
- 3004 Brittney Ln
- 3012 Brittney Ln