3010 Clausen Dr Duncombe, IA 50532
Estimated Value: $194,111 - $235,000
3
Beds
2
Baths
1,520
Sq Ft
$140/Sq Ft
Est. Value
About This Home
This home is located at 3010 Clausen Dr, Duncombe, IA 50532 and is currently estimated at $213,528, approximately $140 per square foot. 3010 Clausen Dr is a home located in Webster County with nearby schools including Pleasant View Elementary School, Northeast Hamilton Elementary School, and Sunset Heights Elementary School.
Ownership History
Date
Name
Owned For
Owner Type
Purchase Details
Closed on
May 27, 2010
Sold by
Clausen Farms Inc
Bought by
Clausen Howard T J
Current Estimated Value
Home Financials for this Owner
Home Financials are based on the most recent Mortgage that was taken out on this home.
Original Mortgage
$88,000
Outstanding Balance
$29,165
Interest Rate
5.12%
Mortgage Type
Future Advance Clause Open End Mortgage
Estimated Equity
$184,363
Create a Home Valuation Report for This Property
The Home Valuation Report is an in-depth analysis detailing your home's value as well as a comparison with similar homes in the area
Home Values in the Area
Average Home Value in this Area
Purchase History
| Date | Buyer | Sale Price | Title Company |
|---|---|---|---|
| Clausen Howard T J | $117,500 | None Available |
Source: Public Records
Mortgage History
| Date | Status | Borrower | Loan Amount |
|---|---|---|---|
| Open | Clausen Howard T J | $88,000 |
Source: Public Records
Tax History Compared to Growth
Tax History
| Year | Tax Paid | Tax Assessment Tax Assessment Total Assessment is a certain percentage of the fair market value that is determined by local assessors to be the total taxable value of land and additions on the property. | Land | Improvement |
|---|---|---|---|---|
| 2025 | $1,874 | $172,370 | $15,780 | $156,590 |
| 2024 | $1,874 | $160,630 | $13,150 | $147,480 |
| 2023 | $1,734 | $160,630 | $13,150 | $147,480 |
| 2022 | $1,690 | $133,550 | $13,150 | $120,400 |
| 2021 | $1,636 | $133,550 | $13,150 | $120,400 |
| 2020 | $1,641 | $124,670 | $13,150 | $111,520 |
| 2019 | $1,622 | $138,950 | $14,470 | $124,480 |
| 2018 | $1,764 | $126,310 | $13,150 | $113,160 |
| 2017 | $1,764 | $109,170 | $0 | $0 |
| 2016 | $1,518 | $109,170 | $0 | $0 |
| 2015 | $1,518 | $109,170 | $0 | $0 |
| 2014 | $1,520 | $109,170 | $0 | $0 |
Source: Public Records
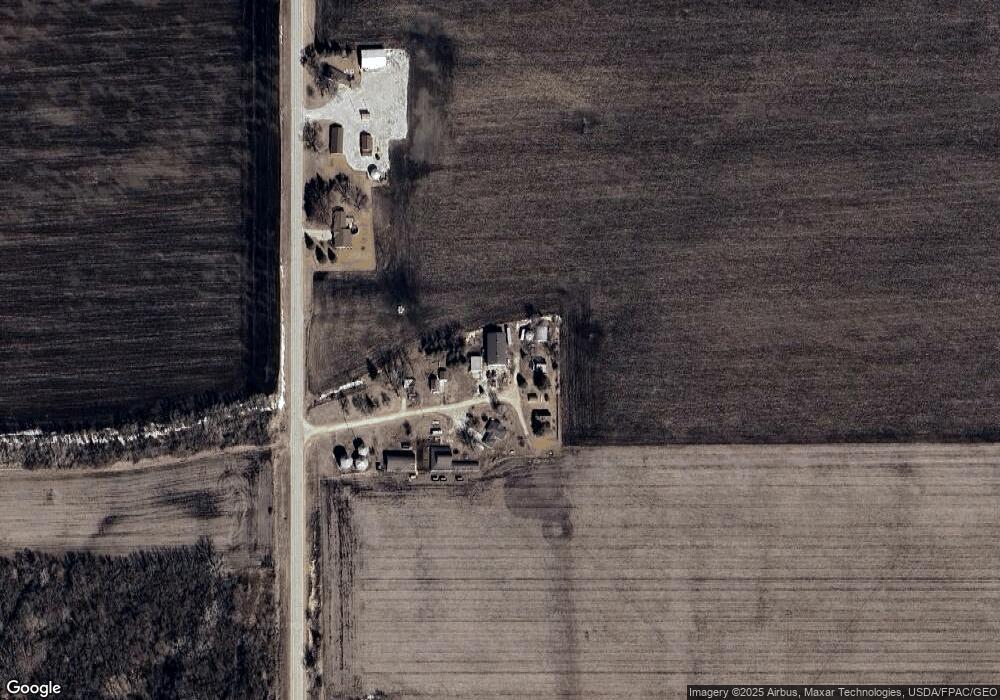
Map
Nearby Homes