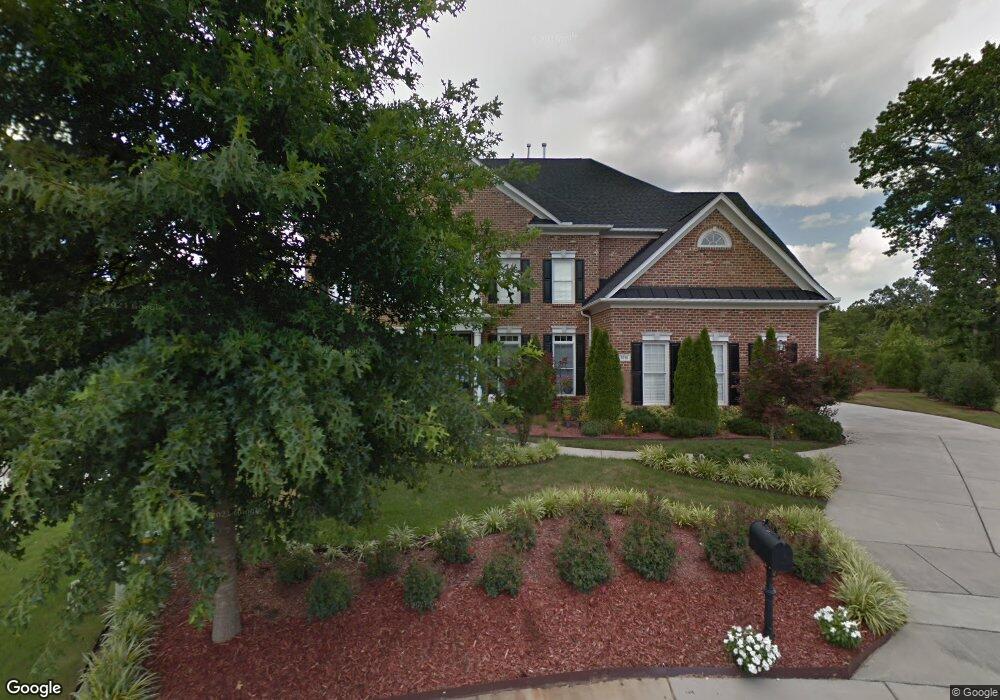
3010 Royal Forrest Dr Raleigh, NC 27614
Estimated Value: $951,024 - $1,263,000
5
Beds
4
Baths
4,745
Sq Ft
$228/Sq Ft
Est. Value
About This Home
This home is located at 3010 Royal Forrest Dr, Raleigh, NC 27614 and is currently estimated at $1,082,506, approximately $228 per square foot. 3010 Royal Forrest Dr is a home located in Wake County with nearby schools including Abbotts Creek Elementary School, Wakefield Middle, and Wakefield High School.
Ownership History
Date
Name
Owned For
Owner Type
Purchase Details
Closed on
Jun 30, 2020
Sold by
Walker Eugene E and Walker Kathleen Ann
Bought by
Walker Eugene Edward and Walker Kathleen Ann
Current Estimated Value
Purchase Details
Closed on
Jan 15, 2016
Sold by
Truscello Edward J and Truscello Paulette
Bought by
Walker Eugene E
Home Financials for this Owner
Home Financials are based on the most recent Mortgage that was taken out on this home.
Original Mortgage
$415,800
Interest Rate
3.96%
Mortgage Type
New Conventional
Purchase Details
Closed on
Apr 22, 2008
Sold by
John Wieland Homes & Neighborhoods Of Th
Bought by
Truscello Edward J and Truscello Paulette
Home Financials for this Owner
Home Financials are based on the most recent Mortgage that was taken out on this home.
Original Mortgage
$300,000
Interest Rate
6.08%
Mortgage Type
Purchase Money Mortgage
Create a Home Valuation Report for This Property
The Home Valuation Report is an in-depth analysis detailing your home's value as well as a comparison with similar homes in the area
Home Values in the Area
Average Home Value in this Area
Purchase History
| Date | Buyer | Sale Price | Title Company |
|---|---|---|---|
| Walker Eugene Edward | -- | None Available | |
| Walker Living Trust | -- | None Listed On Document | |
| Walker Eugene E | $693,000 | None Available | |
| Truscello Edward J | $831,500 | None Available |
Source: Public Records
Mortgage History
| Date | Status | Borrower | Loan Amount |
|---|---|---|---|
| Previous Owner | Walker Eugene E | $415,800 | |
| Previous Owner | Truscello Edward J | $300,000 |
Source: Public Records
Tax History Compared to Growth
Tax History
| Year | Tax Paid | Tax Assessment Tax Assessment Total Assessment is a certain percentage of the fair market value that is determined by local assessors to be the total taxable value of land and additions on the property. | Land | Improvement |
|---|---|---|---|---|
| 2025 | -- | $840,155 | $125,000 | $715,155 |
| 2024 | $7,317 | $840,155 | $125,000 | $715,155 |
| 2023 | $6,224 | $569,181 | $95,000 | $474,181 |
| 2022 | $5,783 | $569,181 | $95,000 | $474,181 |
| 2021 | $5,558 | $569,181 | $95,000 | $474,181 |
| 2020 | $5,457 | $569,181 | $95,000 | $474,181 |
| 2019 | $6,995 | $601,832 | $110,000 | $491,832 |
| 2018 | $6,596 | $601,832 | $110,000 | $491,832 |
| 2017 | $6,281 | $601,832 | $110,000 | $491,832 |
| 2016 | -- | $601,832 | $110,000 | $491,832 |
| 2015 | $8,355 | $804,907 | $136,000 | $668,907 |
| 2014 | $7,923 | $804,907 | $136,000 | $668,907 |
Source: Public Records
Map
Nearby Homes
- 2822 Winter Song Rd
- 3606 Silver Forrest Ln
- 10701 Royal Forrest Dr
- 2536 Bent Green St
- 2419 Rogerson St
- 2704 Snowy Meadow Ct
- 3821 Falls River Ave
- 2545 Forest Shadows Ln
- 2202 Spacious Skies St
- 2201 Wide River Dr
- 2561 Bent Green St
- 2728 Cloud Mist Cir
- 3436 Falls River Ave
- 3428 van Hessen Dr
- 2740 Cloud Mist Cir
- 10507 Bedfordtown Dr
- 10638 Cardington Ln
- 3405 van Hessen Dr
- 10603 Friendly Neighbor Ln
- 2738 Garden Knoll Ln
- 3008 Royal Forrest Dr
- 3009 Royal Forrest Dr
- 3004 Royal Forrest Dr
- 3005 Royal Forrest Dr
- 2910 Royal Forrest Dr
- 2825 Winter Song Rd
- 2817 Winter Song Rd
- 3605 Strolling Ct
- 2821 Winter Song Rd
- 2829 Winter Song Rd
- 2813 Winter Song Rd
- 3609 Strolling Ct
- 3611 Strolling Ct
- 2808 Royal Forrest Dr
- 2809 Winter Song Rd
- 2809 Winter Song Rd Unit 2738
- 2759 Hidden Waters Cir
- 2755 Hidden Waters Cir
- 2755 Hidden Waters Cir Unit L1887
- 2804 Royal Forrest Dr