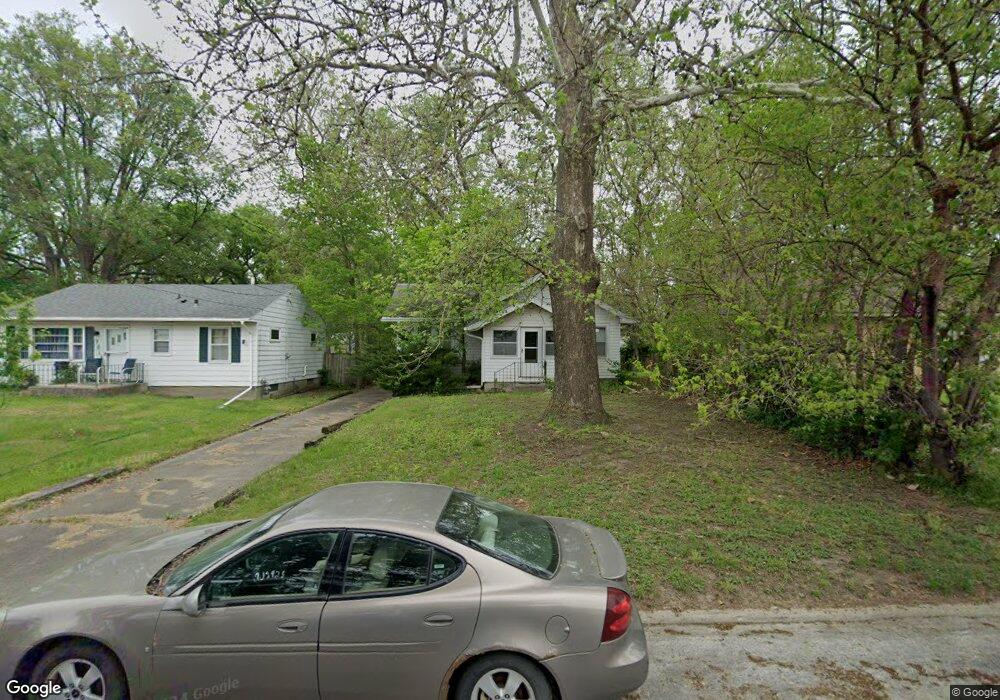
3011 57th St Des Moines, IA 50310
Merle Hay NeighborhoodEstimated Value: $137,000 - $169,000
2
Beds
1
Bath
698
Sq Ft
$218/Sq Ft
Est. Value
About This Home
This home is located at 3011 57th St, Des Moines, IA 50310 and is currently estimated at $152,408, approximately $218 per square foot. 3011 57th St is a home located in Polk County with nearby schools including Moore Elementary School, Meredith Middle School, and Hoover High School.
Ownership History
Date
Name
Owned For
Owner Type
Purchase Details
Closed on
Dec 1, 2023
Sold by
Wilshire Holdings Llc
Bought by
Revive 515 Llc
Current Estimated Value
Purchase Details
Closed on
May 30, 2014
Sold by
Walker Marta
Bought by
Walker Marta and Walker Joseph
Create a Home Valuation Report for This Property
The Home Valuation Report is an in-depth analysis detailing your home's value as well as a comparison with similar homes in the area
Home Values in the Area
Average Home Value in this Area
Purchase History
| Date | Buyer | Sale Price | Title Company |
|---|---|---|---|
| Revive 515 Llc | -- | None Listed On Document | |
| Walker Marta | -- | None Available |
Source: Public Records
Tax History Compared to Growth
Tax History
| Year | Tax Paid | Tax Assessment Tax Assessment Total Assessment is a certain percentage of the fair market value that is determined by local assessors to be the total taxable value of land and additions on the property. | Land | Improvement |
|---|---|---|---|---|
| 2025 | $2,050 | $119,600 | $52,300 | $67,300 |
| 2024 | $2,050 | $108,000 | $47,300 | $60,700 |
| 2023 | $2,094 | $114,700 | $47,300 | $67,400 |
| 2022 | $2,094 | $97,700 | $41,100 | $56,600 |
| 2021 | $2,076 | $97,700 | $41,100 | $56,600 |
| 2020 | $2,074 | $88,800 | $37,500 | $51,300 |
| 2019 | $1,892 | $88,800 | $37,500 | $51,300 |
| 2018 | $1,866 | $78,900 | $33,000 | $45,900 |
| 2017 | $1,672 | $78,900 | $33,000 | $45,900 |
| 2016 | $1,622 | $70,300 | $29,500 | $40,800 |
| 2015 | $1,622 | $70,300 | $29,500 | $40,800 |
| 2014 | $1,520 | $65,900 | $27,400 | $38,500 |
Source: Public Records
Map
Nearby Homes