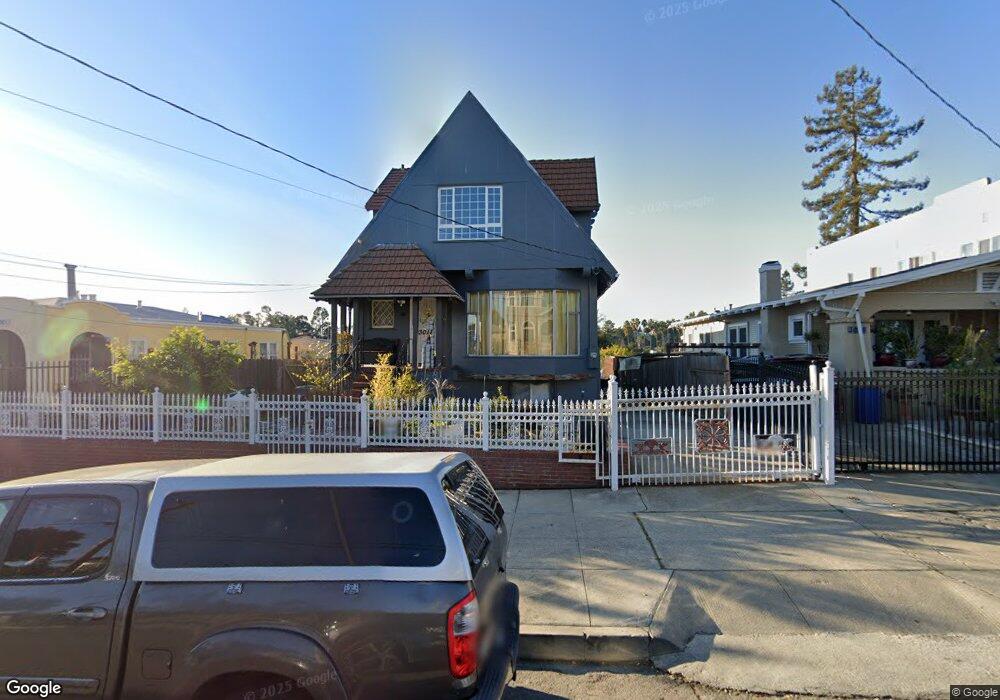
3011 Capp St Oakland, CA 94602
School NeighborhoodEstimated Value: $775,000 - $936,245
3
Beds
2
Baths
1,635
Sq Ft
$505/Sq Ft
Est. Value
About This Home
This home is located at 3011 Capp St, Oakland, CA 94602 and is currently estimated at $825,811, approximately $505 per square foot. 3011 Capp St is a home located in Alameda County with nearby schools including Fruitvale Elementary School, Bret Harte Middle School, and Skyline High School.
Ownership History
Date
Name
Owned For
Owner Type
Purchase Details
Closed on
Apr 13, 2018
Sold by
Nguyen Kelly and Dang Bao V
Bought by
Nguyen Thuy Thi and Vanhuynh Dzu Van
Current Estimated Value
Home Financials for this Owner
Home Financials are based on the most recent Mortgage that was taken out on this home.
Original Mortgage
$300,000
Outstanding Balance
$257,935
Interest Rate
4.43%
Mortgage Type
New Conventional
Estimated Equity
$567,876
Purchase Details
Closed on
Aug 7, 2016
Sold by
Nguyen Kelly and Dang Bao V
Bought by
Nguyen Kelly and Dang Bao V
Purchase Details
Closed on
Mar 30, 2016
Sold by
Nguyen Kelly
Bought by
Nguyen Kelly and Dang Bao V
Home Financials for this Owner
Home Financials are based on the most recent Mortgage that was taken out on this home.
Original Mortgage
$305,000
Interest Rate
3.65%
Mortgage Type
New Conventional
Purchase Details
Closed on
Jan 4, 2007
Sold by
Dang Bao
Bought by
Nguyen Kelly
Home Financials for this Owner
Home Financials are based on the most recent Mortgage that was taken out on this home.
Original Mortgage
$355,500
Interest Rate
6.09%
Mortgage Type
New Conventional
Purchase Details
Closed on
Dec 2, 2003
Sold by
Ferrer Robert C
Bought by
Nguyen Kelly
Home Financials for this Owner
Home Financials are based on the most recent Mortgage that was taken out on this home.
Original Mortgage
$312,000
Interest Rate
5.25%
Mortgage Type
Purchase Money Mortgage
Purchase Details
Closed on
Jul 20, 1998
Sold by
Ferrer Venee C
Bought by
Ferrer Robert C
Home Financials for this Owner
Home Financials are based on the most recent Mortgage that was taken out on this home.
Original Mortgage
$167,200
Interest Rate
6.95%
Purchase Details
Closed on
May 22, 1998
Sold by
Chase Bank Of Texas Na
Bought by
Ferrer Robert C
Home Financials for this Owner
Home Financials are based on the most recent Mortgage that was taken out on this home.
Original Mortgage
$167,200
Interest Rate
6.95%
Purchase Details
Closed on
Mar 4, 1998
Sold by
Harris David P
Bought by
Chase Bank Of Texas National Assn and Texas Commerce Bank Na
Create a Home Valuation Report for This Property
The Home Valuation Report is an in-depth analysis detailing your home's value as well as a comparison with similar homes in the area
Home Values in the Area
Average Home Value in this Area
Purchase History
| Date | Buyer | Sale Price | Title Company |
|---|---|---|---|
| Nguyen Thuy Thi | -- | Old Republic Title Company | |
| Nguyen Kelly | -- | None Available | |
| Nguyen Kelly | -- | Old Republic Title Company | |
| Nguyen Kelly | -- | Chicago Title Co | |
| Nguyen Kelly | $390,000 | Fidelity National Title Co | |
| Ferrer Robert C | -- | Chicago Title Co | |
| Ferrer Robert C | $176,000 | Chicago Title Co | |
| Chase Bank Of Texas National Assn | $197,000 | Stewart Title |
Source: Public Records
Mortgage History
| Date | Status | Borrower | Loan Amount |
|---|---|---|---|
| Open | Nguyen Thuy Thi | $300,000 | |
| Closed | Nguyen Kelly | $305,000 | |
| Closed | Nguyen Kelly | $355,500 | |
| Closed | Nguyen Kelly | $312,000 | |
| Previous Owner | Ferrer Robert C | $167,200 | |
| Closed | Nguyen Kelly | $39,000 |
Source: Public Records
Tax History Compared to Growth
Tax History
| Year | Tax Paid | Tax Assessment Tax Assessment Total Assessment is a certain percentage of the fair market value that is determined by local assessors to be the total taxable value of land and additions on the property. | Land | Improvement |
|---|---|---|---|---|
| 2025 | $11,210 | $750,954 | $225,286 | $525,668 |
| 2024 | $11,210 | $736,230 | $220,869 | $515,361 |
| 2023 | $11,778 | $721,795 | $216,538 | $505,257 |
| 2022 | $11,483 | $707,644 | $212,293 | $495,351 |
| 2021 | $14,829 | $693,771 | $208,131 | $485,640 |
| 2020 | $10,896 | $686,663 | $205,999 | $480,664 |
| 2019 | $13,024 | $856,800 | $257,040 | $599,760 |
| 2018 | $7,834 | $487,311 | $146,193 | $341,118 |
| 2017 | $7,529 | $477,757 | $143,327 | $334,430 |
| 2016 | $7,265 | $468,390 | $140,517 | $327,873 |
| 2015 | $6,386 | $400,000 | $120,000 | $280,000 |
| 2014 | $5,633 | $340,000 | $102,000 | $238,000 |
Source: Public Records
Map
Nearby Homes