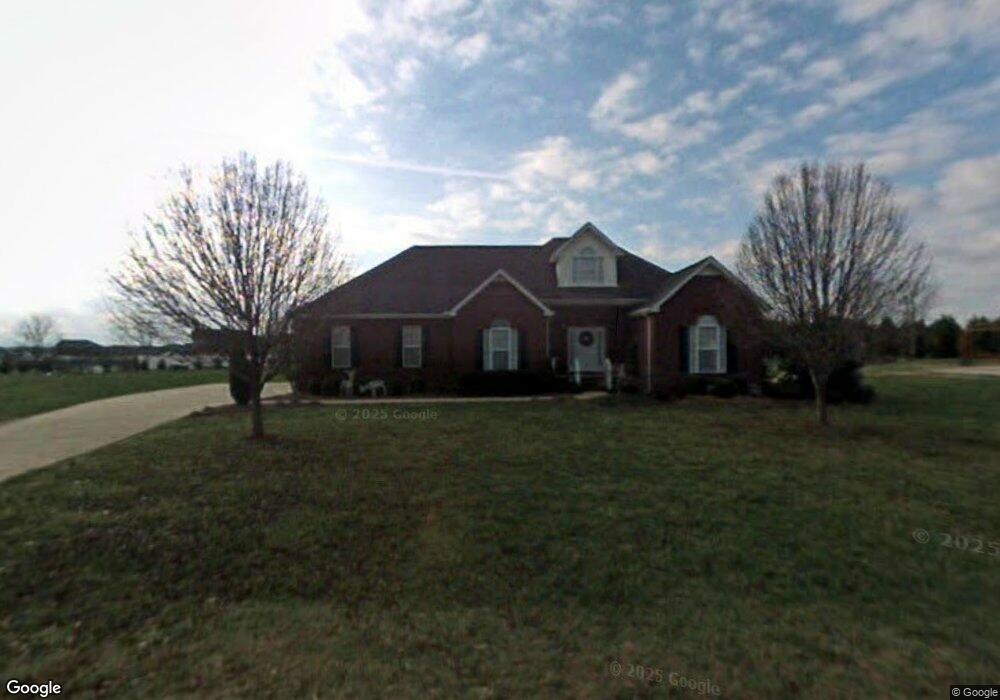
3011 Dunmire Dr Murfreesboro, TN 37129
Estimated Value: $461,619 - $482,000
3
Beds
2
Baths
1,800
Sq Ft
$260/Sq Ft
Est. Value
About This Home
This home is located at 3011 Dunmire Dr, Murfreesboro, TN 37129 and is currently estimated at $467,905, approximately $259 per square foot. 3011 Dunmire Dr is a home located in Rutherford County with nearby schools including Wilson Elementary School, Siegel Middle School, and Siegel High School.
Ownership History
Date
Name
Owned For
Owner Type
Purchase Details
Closed on
Nov 20, 2015
Sold by
Durham Richard B
Bought by
Stuard Cory J
Current Estimated Value
Home Financials for this Owner
Home Financials are based on the most recent Mortgage that was taken out on this home.
Original Mortgage
$204,000
Outstanding Balance
$160,674
Interest Rate
3.83%
Mortgage Type
VA
Estimated Equity
$307,231
Purchase Details
Closed on
Jun 8, 2007
Sold by
Bradley Jennings John
Bought by
Durham Richard B
Home Financials for this Owner
Home Financials are based on the most recent Mortgage that was taken out on this home.
Original Mortgage
$196,811
Interest Rate
6.1%
Mortgage Type
Purchase Money Mortgage
Purchase Details
Closed on
Mar 1, 1999
Sold by
Precision Builders Llc
Bought by
Jennings John B
Create a Home Valuation Report for This Property
The Home Valuation Report is an in-depth analysis detailing your home's value as well as a comparison with similar homes in the area
Home Values in the Area
Average Home Value in this Area
Purchase History
| Date | Buyer | Sale Price | Title Company |
|---|---|---|---|
| Stuard Cory J | $204,000 | -- | |
| Durham Richard B | $199,900 | -- | |
| Jennings John B | $141,900 | -- |
Source: Public Records
Mortgage History
| Date | Status | Borrower | Loan Amount |
|---|---|---|---|
| Open | Stuard Cory J | $204,000 | |
| Previous Owner | Jennings John B | $196,811 |
Source: Public Records
Tax History Compared to Growth
Tax History
| Year | Tax Paid | Tax Assessment Tax Assessment Total Assessment is a certain percentage of the fair market value that is determined by local assessors to be the total taxable value of land and additions on the property. | Land | Improvement |
|---|---|---|---|---|
| 2025 | $1,662 | $88,600 | $13,750 | $74,850 |
| 2024 | $1,662 | $88,600 | $13,750 | $74,850 |
| 2023 | $1,662 | $88,600 | $13,750 | $74,850 |
| 2022 | $1,432 | $88,600 | $13,750 | $74,850 |
| 2021 | $1,347 | $60,700 | $10,625 | $50,075 |
| 2020 | $1,347 | $60,700 | $10,625 | $50,075 |
| 2019 | $1,347 | $60,700 | $10,625 | $50,075 |
| 2018 | $1,274 | $60,700 | $0 | $0 |
| 2017 | $1,238 | $46,200 | $0 | $0 |
| 2016 | $1,238 | $46,200 | $0 | $0 |
| 2015 | $1,238 | $46,200 | $0 | $0 |
| 2014 | $1,140 | $46,200 | $0 | $0 |
| 2013 | -- | $46,625 | $0 | $0 |
Source: Public Records
Map
Nearby Homes
- 111 Cannock Ct
- 3103 Dunmire Dr
- 7408 Cloverdale Way
- 313 Sierra Dr
- 1291 Tiger Woods Way
- 502 Beverly Randolph Dr
- 3714 W Jefferson Pike
- 205 Apricot Ln
- 1429 Clemente Way
- 114 Falling Branch Ct
- 3491 Allen Barrett Rd
- 525 Amberly St
- 2430 J D Todd Rd
- 195 Beverly Randolph Dr
- 193 Knoxleigh Way
- 9914 Debra Dr
- 4288 Central Valley Rd
- 4011 Central Valley Rd
- 7956 Lebanon Rd
- 8988 Big Oak Dr
- 3015 Dunmire Dr
- 3007 Dunmire Dr
- 209 Gloria St
- 105 Kendell Ct
- 205 Gloria St
- 102 Kendell Ct
- 3019 Dunmire Dr
- 3003 Dunmire Dr
- 213 Gloria St
- 106 Kendell Ct
- 104 Cannock Ct
- 3023 Dunmire Dr
- 109 Kendell Ct
- 117 Gloria St
- 103 Praise Ct
- 110 Kendell Ct
- 7569 Powells Chapel Rd
- 108 Cannock Ct
- 7545 Powells Chapel Rd
- 212 Gloria St