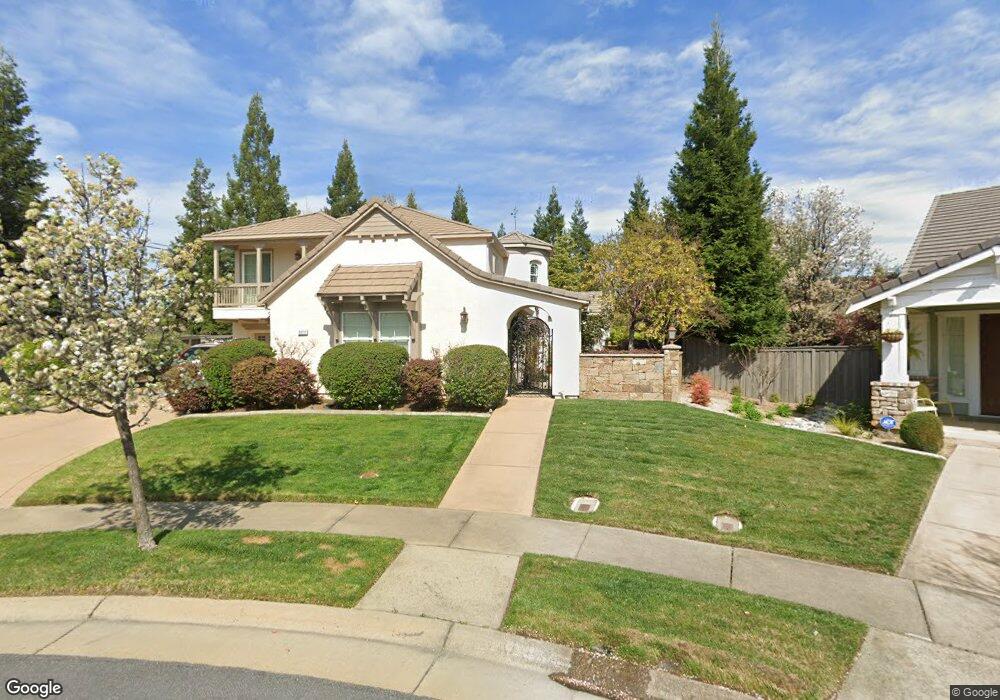
3011 Orchard Park Way Loomis, CA 95650
Estimated Value: $1,169,000 - $1,617,000
5
Beds
4
Baths
3,794
Sq Ft
$367/Sq Ft
Est. Value
About This Home
This home is located at 3011 Orchard Park Way, Loomis, CA 95650 and is currently estimated at $1,391,733, approximately $366 per square foot. 3011 Orchard Park Way is a home located in Placer County with nearby schools including Del Oro High School and Sierra Foothills Academy.
Ownership History
Date
Name
Owned For
Owner Type
Purchase Details
Closed on
Dec 16, 2020
Sold by
Price Nancy
Bought by
Price Nancy
Current Estimated Value
Home Financials for this Owner
Home Financials are based on the most recent Mortgage that was taken out on this home.
Original Mortgage
$476,000
Outstanding Balance
$423,782
Interest Rate
2.7%
Mortgage Type
New Conventional
Estimated Equity
$967,951
Purchase Details
Closed on
Mar 31, 2018
Sold by
Price Stephen
Bought by
Price Nancy
Purchase Details
Closed on
Jul 22, 2005
Sold by
Spiegel Nancy
Bought by
Price Stephen and Spiegel Nancy
Home Financials for this Owner
Home Financials are based on the most recent Mortgage that was taken out on this home.
Original Mortgage
$650,000
Interest Rate
5.93%
Mortgage Type
Fannie Mae Freddie Mac
Create a Home Valuation Report for This Property
The Home Valuation Report is an in-depth analysis detailing your home's value as well as a comparison with similar homes in the area
Home Values in the Area
Average Home Value in this Area
Purchase History
| Date | Buyer | Sale Price | Title Company |
|---|---|---|---|
| Price Nancy | -- | Orange Coast Ttl Co Of Nocal | |
| Price Nancy | -- | Placer Title Co | |
| Price Stephen | -- | Placer Title | |
| Spiegel Nancy | -- | Placer Title | |
| Spiegel Nancy | $834,500 | Placer Title |
Source: Public Records
Mortgage History
| Date | Status | Borrower | Loan Amount |
|---|---|---|---|
| Open | Price Nancy | $476,000 | |
| Closed | Spiegel Nancy | $650,000 |
Source: Public Records
Tax History Compared to Growth
Tax History
| Year | Tax Paid | Tax Assessment Tax Assessment Total Assessment is a certain percentage of the fair market value that is determined by local assessors to be the total taxable value of land and additions on the property. | Land | Improvement |
|---|---|---|---|---|
| 2025 | $12,694 | $1,197,062 | $341,638 | $855,424 |
| 2023 | $12,694 | $1,150,580 | $328,373 | $822,207 |
| 2022 | $10,332 | $937,000 | $267,400 | $669,600 |
| 2021 | $8,957 | $815,000 | $232,600 | $582,400 |
| 2020 | $8,575 | $781,000 | $222,900 | $558,100 |
| 2019 | $8,746 | $797,000 | $227,500 | $569,500 |
| 2018 | $7,293 | $685,000 | $195,500 | $489,500 |
| 2017 | $7,297 | $685,000 | $195,500 | $489,500 |
| 2016 | $6,872 | $668,000 | $190,600 | $477,400 |
| 2015 | $10,137 | $996,023 | $284,264 | $711,759 |
| 2014 | $5,025 | $490,000 | $139,800 | $350,200 |
Source: Public Records
Map
Nearby Homes
- 7241 Orchard Cir
- 3130 Penryn Rd
- 3331 Taylor Rd
- 5986 Mareta Ln
- 5922 Angelo Dr
- 7700 Penryn Estates Dr
- 7700 Penryn Estates
- 6085 Arcadia Ave
- 0 Tracy Ln
- 6385 Arcadia Ave
- 6470 Arcadia Ave
- 3541 Val Verde Rd
- 3521 Val Verde Rd
- 5769 Connie Ct
- 4876 Black Oak Mine Rd
- 7630 Barnes Ln
- 8140 Brookhollow Ct
- 5924 Walnut St
- 5480 Granite Dell Ct
- 3407 Reyman Ln
- 3015 Orchard Park Way
- 3021 Orchard Park Way
- 3021 Orchard Park Ct
- 3018 Orchard Park Way
- 3025 Orchard Park Way
- 3022 Orchard Park Way
- 3031 Orchard Park Way
- 3141 Taylor Rd
- 3028 Orchard Park Way
- 3035 Orchard Park Way
- 3032 Orchard Park Ct
- 3032 Orchard Park Way
- 3173 Taylor Rd
- 3041 Orchard Park Way
- 3110 Del Oro Dr
- 3045 Orchard Park Way
- 3120 Del Oro Dr
- 3051 Orchard Park Way
- 3130 Del Oro Dr
- 3160 Moonshine Ln