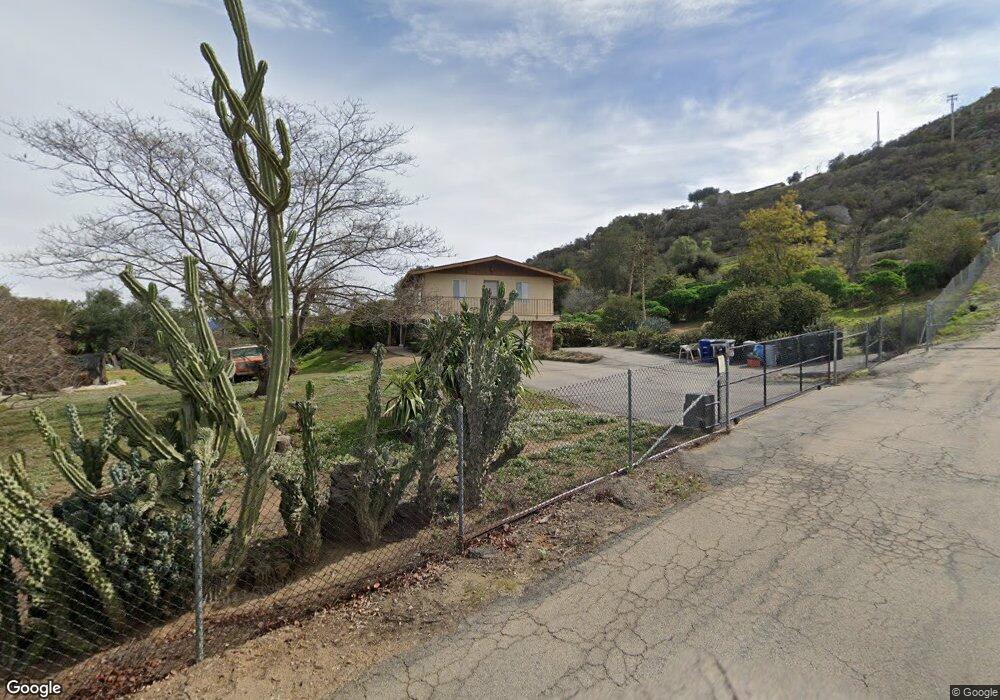
30115 Coyote Run Valley Center, CA 92082
Estimated Value: $537,000 - $1,072,000
4
Beds
3
Baths
2,150
Sq Ft
$371/Sq Ft
Est. Value
About This Home
This home is located at 30115 Coyote Run, Valley Center, CA 92082 and is currently estimated at $796,753, approximately $370 per square foot. 30115 Coyote Run is a home with nearby schools including Valley Center Middle School, Valley Center High School, and Oak Glen High School.
Ownership History
Date
Name
Owned For
Owner Type
Purchase Details
Closed on
Aug 26, 2021
Sold by
Bettis Julie A
Bought by
Bettis Julie A and Julie A Bettis Family Rlt
Current Estimated Value
Purchase Details
Closed on
Aug 30, 2004
Sold by
Bernsen Irving M and Bernsen Elaine D
Bought by
Bettis Julie A
Home Financials for this Owner
Home Financials are based on the most recent Mortgage that was taken out on this home.
Original Mortgage
$300,000
Outstanding Balance
$150,409
Interest Rate
6.06%
Mortgage Type
Unknown
Estimated Equity
$646,344
Purchase Details
Closed on
Aug 13, 2004
Sold by
Bernsen Irving M and Bernsen Elaine D
Bought by
Bernsen Irving M and Bernsen Elaine D
Home Financials for this Owner
Home Financials are based on the most recent Mortgage that was taken out on this home.
Original Mortgage
$300,000
Outstanding Balance
$150,409
Interest Rate
6.06%
Mortgage Type
Unknown
Estimated Equity
$646,344
Create a Home Valuation Report for This Property
The Home Valuation Report is an in-depth analysis detailing your home's value as well as a comparison with similar homes in the area
Home Values in the Area
Average Home Value in this Area
Purchase History
| Date | Buyer | Sale Price | Title Company |
|---|---|---|---|
| Bettis Julie A | -- | None Available | |
| Bettis Julie A | $300,000 | North American Title Co | |
| Bernsen Irving M | -- | North American Title Co |
Source: Public Records
Mortgage History
| Date | Status | Borrower | Loan Amount |
|---|---|---|---|
| Open | Bettis Julie A | $300,000 |
Source: Public Records
Tax History Compared to Growth
Tax History
| Year | Tax Paid | Tax Assessment Tax Assessment Total Assessment is a certain percentage of the fair market value that is determined by local assessors to be the total taxable value of land and additions on the property. | Land | Improvement |
|---|---|---|---|---|
| 2025 | $2,134 | $173,261 | $34,656 | $138,605 |
| 2024 | $2,134 | $169,865 | $33,977 | $135,888 |
| 2023 | $2,080 | $166,535 | $33,311 | $133,224 |
| 2022 | $2,033 | $163,270 | $32,658 | $130,612 |
| 2021 | $1,989 | $160,069 | $32,018 | $128,051 |
| 2020 | $1,966 | $158,428 | $31,690 | $126,738 |
| 2019 | $1,967 | $155,322 | $31,069 | $124,253 |
| 2018 | $1,915 | $152,277 | $30,460 | $121,817 |
| 2017 | $1,874 | $149,292 | $29,863 | $119,429 |
| 2016 | $1,871 | $146,366 | $29,278 | $117,088 |
| 2015 | $1,852 | $144,169 | $28,839 | $115,330 |
| 2014 | $1,809 | $141,346 | $28,275 | $113,071 |
Source: Public Records
Map
Nearby Homes
- 14931 Cool Valley Rd
- 14443 Cool Valley Rd
- 30265 Miller Rd
- 30237 Cole Grade Rd
- 30118 Miller Rd Unit 22
- 15519 Villa Sierra Rd
- 32911 Cole Grade Rd Unit 1
- 3.45 ac Citrus Crest Dr Unit 36
- 14748 Cool Valley Ranch Rd
- 29568 Viking View Ln
- 14786 Cool Valley Ranch Rd
- 15110 Ayers Ln
- 31141 Saddleback Rd
- 9389 Covey Ln
- 0 Courser Canyon Rd Unit 40 250037088
- 14502 Fruitvale Rd
- 29532 Viking View Ln
- 29527 Viking View Ln
- 31340 N Star Way
- 13815 Hilldale Rd
- 30634 Persimmon Ln
- 30655 Persimmon Ln
- 14683 Puma Trail
- 30620 Miller Rd
- 14651 Puma Trail
- 14711 Puma Trail
- 14722 Sturnella Way
- 30220 Coyote Run
- 14723 Puma Trail
- 30678 Persimmon Ln
- 30683 Persimmon Ln
- 30639 Rabbit Run
- 14712 Sturnella Way
- 14625 Puma Trail
- 14674 Sturnella Way
- 30017 Wilhite Ln
- 14754 Sturnella Way
- 30612 Miller Rd
- 14785 Puma Trail
- 30250 Coyote Run