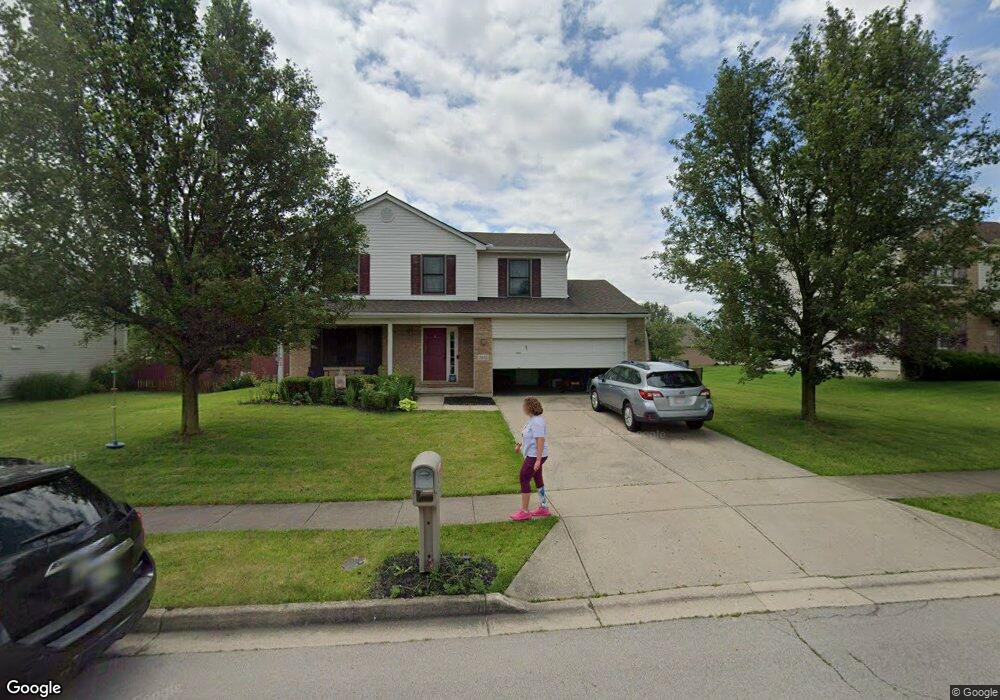
3012 Clearstream Way Clayton, OH 45315
Estimated Value: $325,766 - $339,000
4
Beds
3
Baths
2,504
Sq Ft
$132/Sq Ft
Est. Value
About This Home
This home is located at 3012 Clearstream Way, Clayton, OH 45315 and is currently estimated at $331,192, approximately $132 per square foot. 3012 Clearstream Way is a home located in Montgomery County with nearby schools including Northmont High School and Salem Christian Academy.
Ownership History
Date
Name
Owned For
Owner Type
Purchase Details
Closed on
Aug 2, 2021
Sold by
Smith Kenneth R and Smith Stephanie A
Bought by
Branham Mariah and Branham Christopher
Current Estimated Value
Home Financials for this Owner
Home Financials are based on the most recent Mortgage that was taken out on this home.
Original Mortgage
$247,000
Outstanding Balance
$222,783
Interest Rate
2.8%
Mortgage Type
New Conventional
Estimated Equity
$108,409
Purchase Details
Closed on
Jun 9, 2000
Sold by
Crossmann Communities Of Ohio Inc
Bought by
Nussman Phillip G and Nussman Lisa
Home Financials for this Owner
Home Financials are based on the most recent Mortgage that was taken out on this home.
Original Mortgage
$148,620
Interest Rate
8.31%
Mortgage Type
FHA
Create a Home Valuation Report for This Property
The Home Valuation Report is an in-depth analysis detailing your home's value as well as a comparison with similar homes in the area
Home Values in the Area
Average Home Value in this Area
Purchase History
| Date | Buyer | Sale Price | Title Company |
|---|---|---|---|
| Branham Mariah | $260,000 | None Available | |
| Nussman Phillip G | $155,500 | -- |
Source: Public Records
Mortgage History
| Date | Status | Borrower | Loan Amount |
|---|---|---|---|
| Open | Branham Mariah | $247,000 | |
| Closed | Nussman Phillip G | $148,620 |
Source: Public Records
Tax History
| Year | Tax Paid | Tax Assessment Tax Assessment Total Assessment is a certain percentage of the fair market value that is determined by local assessors to be the total taxable value of land and additions on the property. | Land | Improvement |
|---|---|---|---|---|
| 2025 | $5,368 | $91,360 | $15,440 | $75,920 |
| 2024 | $5,199 | $91,360 | $15,440 | $75,920 |
| 2023 | $5,199 | $91,360 | $15,440 | $75,920 |
| 2022 | $5,358 | $72,500 | $12,250 | $60,250 |
| 2021 | $5,373 | $72,500 | $12,250 | $60,250 |
| 2020 | $5,274 | $72,500 | $12,250 | $60,250 |
| 2019 | $5,039 | $62,100 | $13,600 | $48,500 |
| 2018 | $4,947 | $62,100 | $13,600 | $48,500 |
| 2017 | $4,913 | $62,100 | $13,600 | $48,500 |
| 2016 | $3,970 | $49,260 | $12,250 | $37,010 |
| 2015 | $3,731 | $49,260 | $12,250 | $37,010 |
| 2014 | $3,731 | $49,260 | $12,250 | $37,010 |
| 2012 | -- | $51,940 | $12,250 | $39,690 |
Source: Public Records
Map
Nearby Homes
- 320 Sagebrush Dr
- 8849 Meiring St
- 4784 Molunat
- 325 Beechgrove Dr
- 114 Brumbaugh Ct
- 332 Beckenham Rd
- 4614 W Wenger Rd
- 211 Butler Trail
- Chatham Plan at Wenger Village
- Milford Plan at Wenger Village
- Holcombe Plan at Wenger Village
- Newcastle Plan at Wenger Village
- Pendleton Plan at Wenger Village
- Bellamy Plan at Wenger Village
- Henley Plan at Wenger Village
- 5769 Dill Blvd
- 802 Nordhoff Farm Dr
- 4245 W Wenger Rd
- 619 Overla Blvd
- 118 Elm Ct
- 3014 Clearstream Way
- 3010 Clearstream Way
- 4067 Twin Lakes Cir
- 4063 Twin Lakes Cir
- 4071 Twin Lakes Cir
- 4061 Twin Lakes Cir
- 3013 Clearstream Way
- 4075 Twin Lakes Cir
- 3011 Clearstream Way
- 3015 Clearstream Way
- 4073 Twin Lakes Cir
- 4055 Twin Lakes Cir
- 3006 Clearstream Way
- 3009 Clearstream Way
- 3017 Clearstream Way
- 4053 Twin Lakes Cir
- 301 Windgate Ct
- 4057 Twin Lakes Cir
- 4060 Twin Lakes Cir
- 4051 Twin Lakes Cir