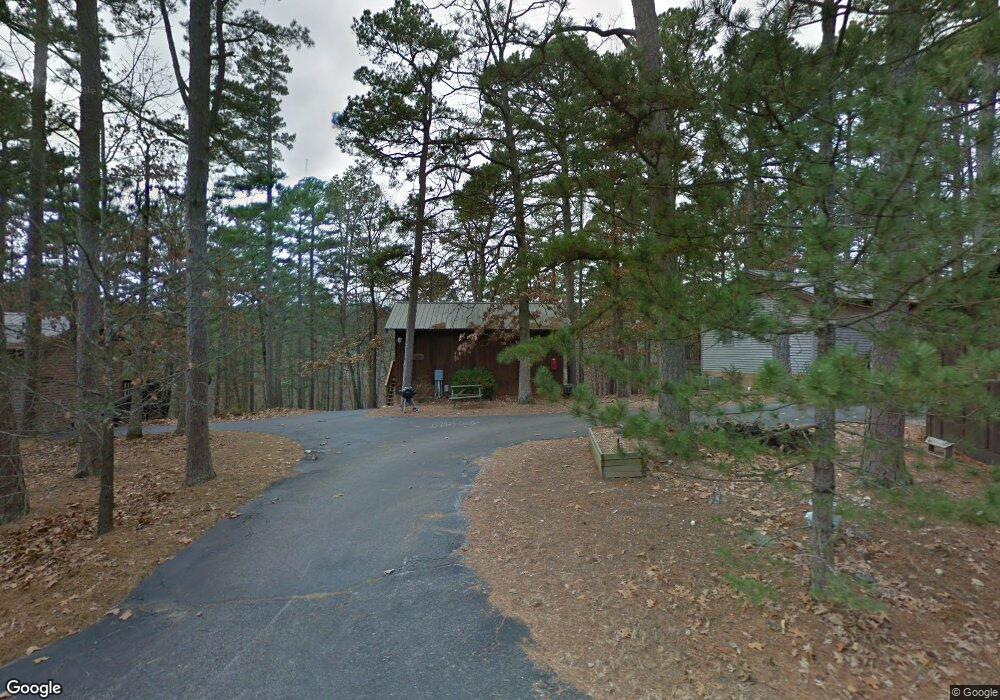
3012 E Van Buren Eureka Springs, AR 72632
Estimated Value: $561,000 - $1,384,000
--
Bed
1
Bath
8,629
Sq Ft
$117/Sq Ft
Est. Value
About This Home
This home is located at 3012 E Van Buren, Eureka Springs, AR 72632 and is currently estimated at $1,013,061, approximately $117 per square foot. 3012 E Van Buren is a home located in Carroll County with nearby schools including Eureka Springs Elementary School, Eureka Springs Middle School, and Eureka Springs High School.
Ownership History
Date
Name
Owned For
Owner Type
Purchase Details
Closed on
Jan 14, 2020
Sold by
Harden Donald R and Harden Elaine R
Bought by
Hvcal Llc
Current Estimated Value
Purchase Details
Closed on
Jul 21, 2017
Sold by
Dowland John and Dowland Beverly Marie
Bought by
Harden Donald R and Harden Elaine R
Home Financials for this Owner
Home Financials are based on the most recent Mortgage that was taken out on this home.
Original Mortgage
$537,500
Interest Rate
3.89%
Mortgage Type
Future Advance Clause Open End Mortgage
Purchase Details
Closed on
Jan 31, 2005
Sold by
Fargo
Bought by
Dowland
Purchase Details
Closed on
Jun 16, 1999
Sold by
Fargo
Bought by
Fargo
Purchase Details
Closed on
Apr 12, 1999
Sold by
Blanchard
Bought by
Fargo and Fargo Scroggin
Purchase Details
Closed on
Mar 17, 1993
Sold by
Bird
Bought by
Ea Fargo
Create a Home Valuation Report for This Property
The Home Valuation Report is an in-depth analysis detailing your home's value as well as a comparison with similar homes in the area
Home Values in the Area
Average Home Value in this Area
Purchase History
| Date | Buyer | Sale Price | Title Company |
|---|---|---|---|
| Hvcal Llc | -- | None Available | |
| Harden Donald R | $537,500 | Kings River Title Co | |
| Dowland | $595,000 | -- | |
| Fargo | -- | -- | |
| Fargo | $59,000 | -- | |
| Ea Fargo | $100,000 | -- |
Source: Public Records
Mortgage History
| Date | Status | Borrower | Loan Amount |
|---|---|---|---|
| Previous Owner | Harden Donald R | $537,500 | |
| Previous Owner | Harden Donald R | $150,000 |
Source: Public Records
Tax History Compared to Growth
Tax History
| Year | Tax Paid | Tax Assessment Tax Assessment Total Assessment is a certain percentage of the fair market value that is determined by local assessors to be the total taxable value of land and additions on the property. | Land | Improvement |
|---|---|---|---|---|
| 2025 | $5,113 | $147,210 | $23,970 | $123,240 |
| 2024 | $4,650 | $92,050 | $23,960 | $68,090 |
| 2023 | $4,649 | $92,050 | $23,960 | $68,090 |
| 2022 | $4,650 | $92,050 | $23,960 | $68,090 |
| 2021 | $4,042 | $79,960 | $23,980 | $55,980 |
| 2020 | $4,042 | $79,960 | $23,980 | $55,980 |
| 2019 | $4,060 | $79,960 | $23,980 | $55,980 |
| 2018 | $3,866 | $76,110 | $23,980 | $52,130 |
| 2017 | $3,866 | $76,110 | $23,980 | $52,130 |
| 2016 | $3,608 | $71,360 | $24,000 | $47,360 |
| 2014 | -- | $71,360 | $24,000 | $47,360 |
Source: Public Records
Map
Nearby Homes
- 3012 E Van Buren
- 3012 Holiday Trail
- 3012 E Holiday Trail St
- 2015 Holiday Island
- 3010 E Van Buren
- 2100 E Van Buren
- 0 Hwy 187 Lot 8 Unit 1073236
- 2106 E Van Buren
- 2094 E Van Buren
- 0 Lot 13 Block 8 Holid Ln Unit 737244
- 2270 van Buren (Hwy 62) Hwy
- 3022-H E Van Buren St
- 3022 E Van Buren
- 3111 E Van Buren
- 0 E 62 Hwy Unit 462863
- 0 E 62 Hwy Unit 534659
- 0 E 62 Hwy Unit 537646
- 0 E 62 Hwy Unit 703417
- 0 E 62 Hwy Unit 726082
- 0 E 62 Hwy Unit 1082556