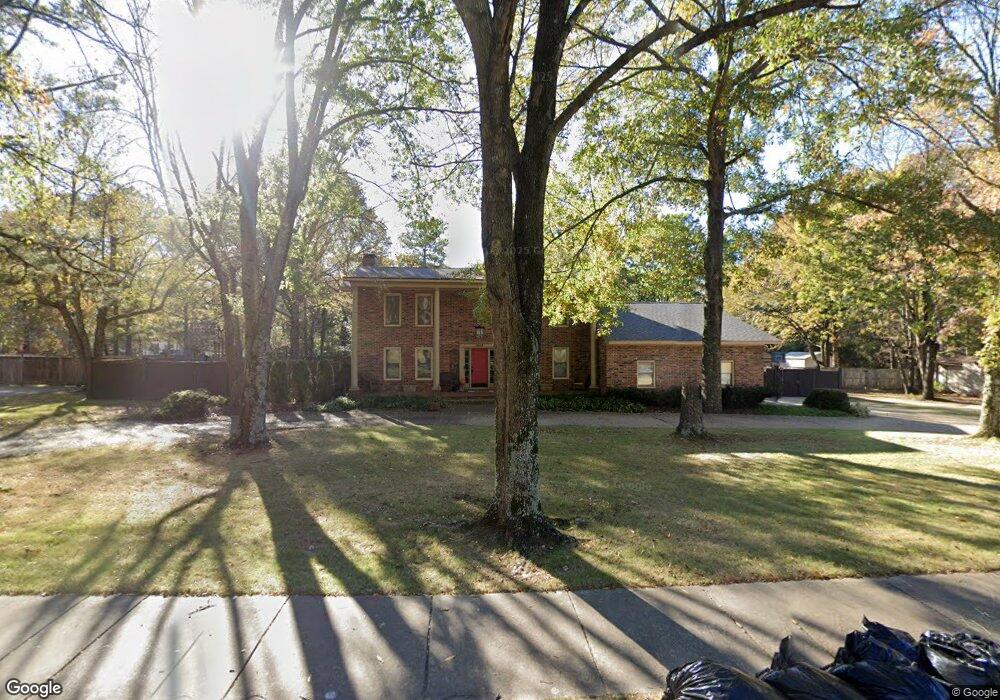
3012 Hinson Rd Little Rock, AR 72212
River Mountain NeighborhoodEstimated Value: $464,000 - $489,115
--
Bed
4
Baths
3,029
Sq Ft
$159/Sq Ft
Est. Value
About This Home
This home is located at 3012 Hinson Rd, Little Rock, AR 72212 and is currently estimated at $480,279, approximately $158 per square foot. 3012 Hinson Rd is a home located in Pulaski County with nearby schools including Don Roberts Elementary School, Pinnacle View Middle School, and Founders Classical Academy - West Little Rock.
Ownership History
Date
Name
Owned For
Owner Type
Purchase Details
Closed on
Oct 30, 2020
Sold by
Ritchey Michael and Ritchey Monica
Bought by
Bright Sarah K
Current Estimated Value
Home Financials for this Owner
Home Financials are based on the most recent Mortgage that was taken out on this home.
Original Mortgage
$312,000
Outstanding Balance
$276,366
Interest Rate
2.8%
Mortgage Type
New Conventional
Estimated Equity
$203,913
Purchase Details
Closed on
May 9, 2016
Sold by
Fason Linda C
Bought by
Ritchey Michael and Ritchey Monica
Home Financials for this Owner
Home Financials are based on the most recent Mortgage that was taken out on this home.
Original Mortgage
$256,000
Interest Rate
3.59%
Mortgage Type
New Conventional
Purchase Details
Closed on
Apr 22, 2016
Sold by
Fason Rufus C
Bought by
Fason Linda
Home Financials for this Owner
Home Financials are based on the most recent Mortgage that was taken out on this home.
Original Mortgage
$256,000
Interest Rate
3.59%
Mortgage Type
New Conventional
Create a Home Valuation Report for This Property
The Home Valuation Report is an in-depth analysis detailing your home's value as well as a comparison with similar homes in the area
Home Values in the Area
Average Home Value in this Area
Purchase History
| Date | Buyer | Sale Price | Title Company |
|---|---|---|---|
| Bright Sarah K | $352,000 | All American Title | |
| Ritchey Michael | $320,000 | Pulaski County Title | |
| Fason Linda | -- | Attorney |
Source: Public Records
Mortgage History
| Date | Status | Borrower | Loan Amount |
|---|---|---|---|
| Open | Bright Sarah K | $312,000 | |
| Previous Owner | Ritchey Michael | $256,000 |
Source: Public Records
Tax History Compared to Growth
Tax History
| Year | Tax Paid | Tax Assessment Tax Assessment Total Assessment is a certain percentage of the fair market value that is determined by local assessors to be the total taxable value of land and additions on the property. | Land | Improvement |
|---|---|---|---|---|
| 2025 | $4,922 | $76,066 | $19,008 | $57,058 |
| 2024 | $4,512 | $76,066 | $19,008 | $57,058 |
| 2023 | $4,512 | $76,066 | $19,008 | $57,058 |
| 2022 | $4,306 | $76,066 | $19,008 | $57,058 |
| 2021 | $4,131 | $58,590 | $12,100 | $46,490 |
| 2020 | $3,726 | $58,590 | $12,100 | $46,490 |
| 2019 | $3,726 | $58,590 | $12,100 | $46,490 |
| 2018 | $3,751 | $58,590 | $12,100 | $46,490 |
| 2017 | $3,751 | $58,590 | $12,100 | $46,490 |
| 2016 | $3,530 | $55,430 | $14,000 | $41,430 |
| 2015 | $3,886 | $55,430 | $14,000 | $41,430 |
| 2014 | $3,886 | $55,430 | $14,000 | $41,430 |
Source: Public Records
Map
Nearby Homes
- 21 La Scala Ct
- 31 La Scala Ct
- 11 La Scala Ct
- 7 Longlea Cove
- 9 Longlea Cove
- 2 Hyde Ct
- 3403 Montrose Dr
- 25 Windsor Ct
- 2 Longlea Dr
- 2110 Westport Loop
- 14 Pointe Clear Dr
- 4 White Willow Ct
- 2 Sawgrass Ct
- 18 Hickory Hills Cir
- 22 Flourite Cove
- 2201 Huntleigh Ct
- 186 Pebble Beach Dr
- 5 Pine View Place
- 15 Flourite Ct
- 152 Hickory Creek Cir
- 3100 Hinson Rd
- 3006 Hinson Rd
- 14 Valley Forge Dr
- 16 Valley Forge Dr
- 12 Valley Forge Dr
- 3000 Hinson Rd
- 2 Portia Dr
- 10 Valley Forge Dr
- 1 Coventry Ln
- 5 Cannon Ct
- 18 Valley Forge Dr
- 3106 Hinson Rd
- 7 Cannon Ct
- 15 Valley Forge Dr
- 0 Valley Forge Dr
- 11 Valley Forge Dr
- 1 Portia Dr
- 2916 Hinson Rd
- 3 Coventry Ln
- 4 Portia Dr