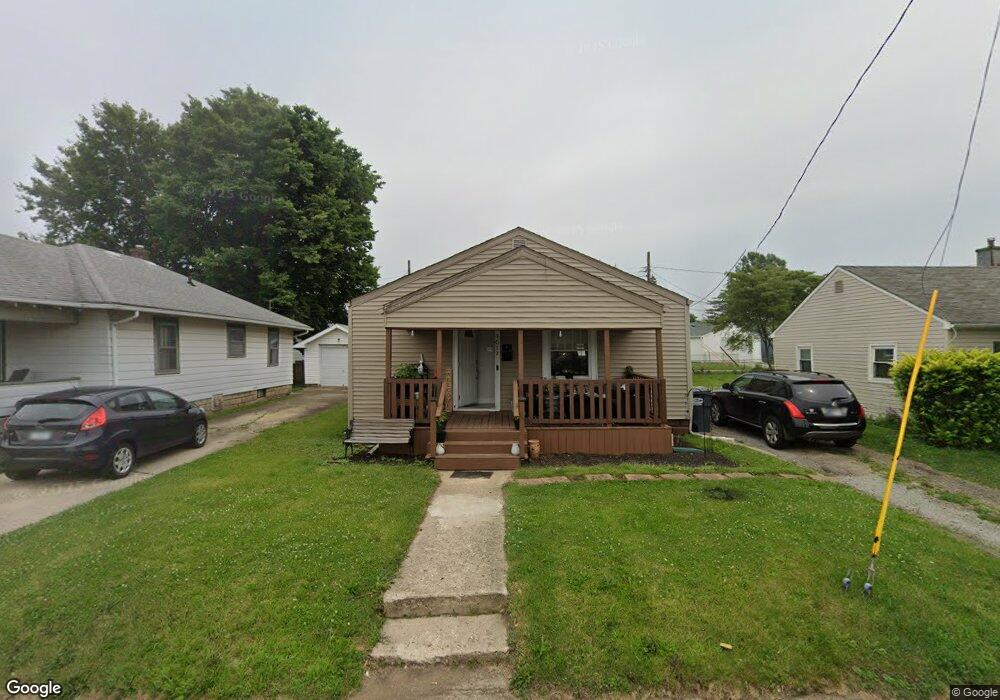
3012 Main St Anderson, IN 46016
Estimated Value: $66,000 - $97,979
2
Beds
1
Bath
936
Sq Ft
$87/Sq Ft
Est. Value
About This Home
This home is located at 3012 Main St, Anderson, IN 46016 and is currently estimated at $81,245, approximately $86 per square foot. 3012 Main St is a home located in Madison County with nearby schools including Erskine Elementary School, Highland Middle School, and Anderson High School.
Ownership History
Date
Name
Owned For
Owner Type
Purchase Details
Closed on
Jul 24, 2024
Sold by
Ghebremichael Wallta and Ghebremichael Wegahta
Bought by
Yjb Homes Llc
Current Estimated Value
Home Financials for this Owner
Home Financials are based on the most recent Mortgage that was taken out on this home.
Original Mortgage
$101,250
Outstanding Balance
$99,734
Interest Rate
6.87%
Mortgage Type
Credit Line Revolving
Estimated Equity
-$18,489
Purchase Details
Closed on
Apr 5, 2024
Sold by
Sizelove David L
Bought by
Ghebremichael Wallta and Ghebremichael Wegahta
Create a Home Valuation Report for This Property
The Home Valuation Report is an in-depth analysis detailing your home's value as well as a comparison with similar homes in the area
Home Values in the Area
Average Home Value in this Area
Purchase History
| Date | Buyer | Sale Price | Title Company |
|---|---|---|---|
| Yjb Homes Llc | -- | Vantage Point Title | |
| Yjb Homes Llc | -- | Vantage Point Title | |
| Ghebremichael Wallta | $29,925 | Indiana Home Title |
Source: Public Records
Mortgage History
| Date | Status | Borrower | Loan Amount |
|---|---|---|---|
| Open | Yjb Homes Llc | $101,250 | |
| Closed | Yjb Homes Llc | $101,250 |
Source: Public Records
Tax History
| Year | Tax Paid | Tax Assessment Tax Assessment Total Assessment is a certain percentage of the fair market value that is determined by local assessors to be the total taxable value of land and additions on the property. | Land | Improvement |
|---|---|---|---|---|
| 2025 | $1,525 | $74,400 | $8,200 | $66,200 |
| 2024 | $1,525 | $68,600 | $8,200 | $60,400 |
| 2023 | $1,407 | $62,900 | $7,800 | $55,100 |
| 2022 | $1,407 | $62,900 | $7,300 | $55,600 |
| 2021 | $1,294 | $57,500 | $7,200 | $50,300 |
| 2020 | $1,236 | $54,700 | $6,900 | $47,800 |
| 2019 | $1,208 | $53,400 | $6,900 | $46,500 |
| 2018 | $1,129 | $48,900 | $6,900 | $42,000 |
| 2017 | $966 | $48,300 | $6,900 | $41,400 |
| 2016 | $966 | $48,300 | $6,900 | $41,400 |
| 2014 | $980 | $49,000 | $6,900 | $42,100 |
| 2013 | $980 | $49,000 | $6,900 | $42,100 |
Source: Public Records
Map
Nearby Homes
- 2915 Central Ave
- 3128 Fletcher St
- 2639 Central Ave
- 2619 Meridian St
- 2519 Jackson St
- 309 W 29th St
- 621 E 31st St
- 2443 Meridian St
- 2828 Lincoln St
- 706 E 32nd St
- 321 E 34th St
- 711 E 32nd St
- 2328 Fletcher St
- 2317 Fletcher St
- 2626 Morton St
- 2319 Pearl St
- 130 Elva St
- 2226 Fletcher St
- 217 Ringwood Way
- 3004 Columbus Ave
- 3016 Main St
- 3008 Main St
- 3004 Main St
- 3020 Main St
- 3011 Central Ave
- 3007 Central Ave
- 3015 Central Ave
- 3019 Central Ave
- 3034 Main St
- 2933 Central Ave
- 2922 Main St
- 2929 Central Ave
- 116 E 31st St
- 2920 Main St
- 3040 Main St
- 120 E 31st St
- 2921 Central Ave
- 3010 Central Ave
- 2917 Central Ave
- 3006 Central Ave
Your Personal Tour Guide
Ask me questions while you tour the home.