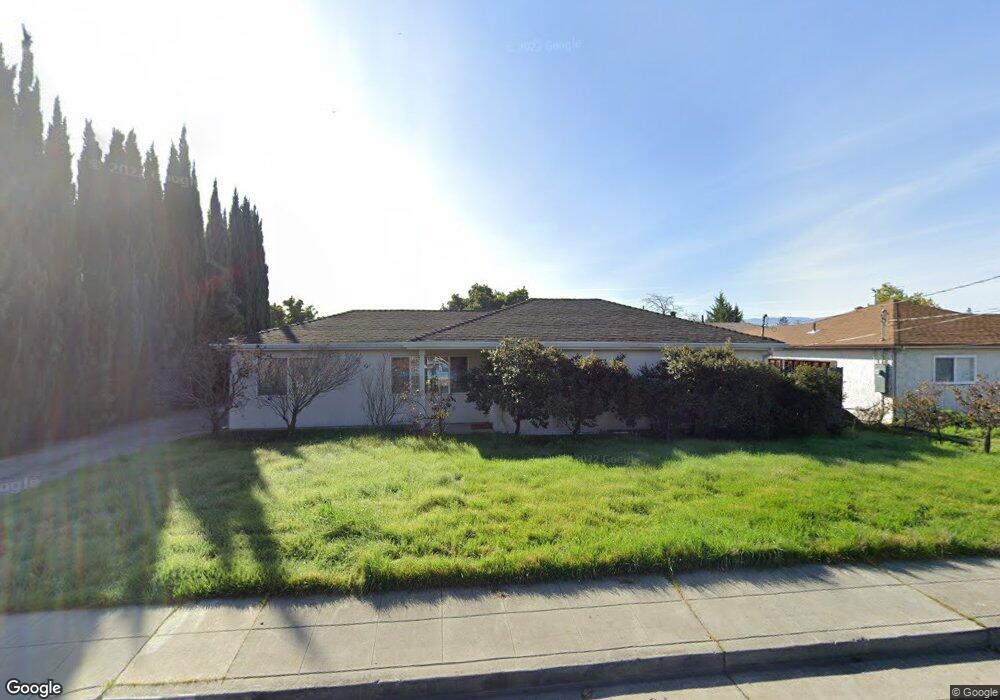
3012 Orthello Way Santa Clara, CA 95051
Estimated Value: $1,759,913 - $1,839,000
4
Beds
2
Baths
842
Sq Ft
$2,147/Sq Ft
Est. Value
About This Home
This home is located at 3012 Orthello Way, Santa Clara, CA 95051 and is currently estimated at $1,807,478, approximately $2,146 per square foot. 3012 Orthello Way is a home located in Santa Clara County with nearby schools including Pomeroy Elementary School, Juan Cabrillo Middle School, and Santa Clara High School.
Ownership History
Date
Name
Owned For
Owner Type
Purchase Details
Closed on
Nov 14, 2024
Sold by
Oprica Dan Grigore and Lordache Mirela
Bought by
Yu Xiaohua and Xia Qing
Current Estimated Value
Purchase Details
Closed on
Dec 10, 1997
Sold by
Oprica Dorina
Bought by
Oprica Dan
Home Financials for this Owner
Home Financials are based on the most recent Mortgage that was taken out on this home.
Original Mortgage
$150,000
Interest Rate
7.19%
Purchase Details
Closed on
Dec 9, 1997
Sold by
Toews Jeff M and Toews Loren
Bought by
Oprica Dan
Home Financials for this Owner
Home Financials are based on the most recent Mortgage that was taken out on this home.
Original Mortgage
$150,000
Interest Rate
7.19%
Purchase Details
Closed on
Apr 8, 1997
Sold by
Rosare Francisca A and Rosare John E
Bought by
Toews Jeff M and Toews Loren
Create a Home Valuation Report for This Property
The Home Valuation Report is an in-depth analysis detailing your home's value as well as a comparison with similar homes in the area
Home Values in the Area
Average Home Value in this Area
Purchase History
| Date | Buyer | Sale Price | Title Company |
|---|---|---|---|
| Yu Xiaohua | $1,800,000 | Fidelity National Title | |
| Oprica Dan | -- | Chicago Title Co | |
| Oprica Dan | $341,500 | Chicago Title Co | |
| Toews Jeff M | $185,000 | -- |
Source: Public Records
Mortgage History
| Date | Status | Borrower | Loan Amount |
|---|---|---|---|
| Previous Owner | Oprica Dan | $150,000 |
Source: Public Records
Tax History Compared to Growth
Tax History
| Year | Tax Paid | Tax Assessment Tax Assessment Total Assessment is a certain percentage of the fair market value that is determined by local assessors to be the total taxable value of land and additions on the property. | Land | Improvement |
|---|---|---|---|---|
| 2025 | $5,341 | $2,000,000 | $1,850,000 | $150,000 |
| 2024 | $5,341 | $446,129 | $407,006 | $39,123 |
| 2023 | $5,801 | $437,382 | $399,026 | $38,356 |
| 2022 | $5,196 | $428,806 | $391,202 | $37,604 |
| 2021 | $5,166 | $420,399 | $383,532 | $36,867 |
| 2020 | $5,672 | $416,089 | $379,600 | $36,489 |
| 2019 | $5,062 | $407,931 | $372,157 | $35,774 |
| 2018 | $4,664 | $399,933 | $364,860 | $35,073 |
| 2017 | $4,639 | $392,092 | $357,706 | $34,386 |
| 2016 | $4,576 | $384,405 | $350,693 | $33,712 |
| 2015 | $4,557 | $378,632 | $345,426 | $33,206 |
| 2014 | $4,238 | $371,216 | $338,660 | $32,556 |
Source: Public Records
Map
Nearby Homes
- 2782 Sonoma Place
- 2785 Ball Place Unit 4
- 986 Kiely Blvd Unit D
- 3033 Kaiser Dr Unit H
- 3079 El Camino Real Unit 101
- 3079 El Camino Real Unit 205
- 3079 El Camino Real Unit 202
- 3089 El Camino Real Unit 9
- 3089 El Camino Real Unit 7
- 3089 El Camino Real Unit 5
- 3089 El Camino Real Unit 11
- 940 Kiely Blvd Unit H
- 960 Kiely Blvd Unit F
- 1545 Pomeroy Ave
- 1496 Mcpherson St
- 1661 Nobili Ave
- 2475 Karen Dr
- 840 Quince Ave Unit 27
- 1174 Carolyn Dr
- 3384 Fowler Ave
- 3032 Orthello Way
- 2992 Orthello Way
- 3011 Humbolt Ave
- 3042 Orthello Way
- 2972 Orthello Way
- 2991 Humbolt Ave
- 3031 Humbolt Ave
- 3011 Orthello Way
- 3031 Orthello Way
- 2991 Orthello Way
- 2971 Humbolt Ave
- 3041 Humbolt Ave
- 2952 Orthello Way
- 3056 Orthello Way
- 3041 Orthello Way
- 2971 Orthello Way
- 2951 Humbolt Ave
- 3055 Humbolt Ave
- 3055 Orthello Way
- 2951 Orthello Way