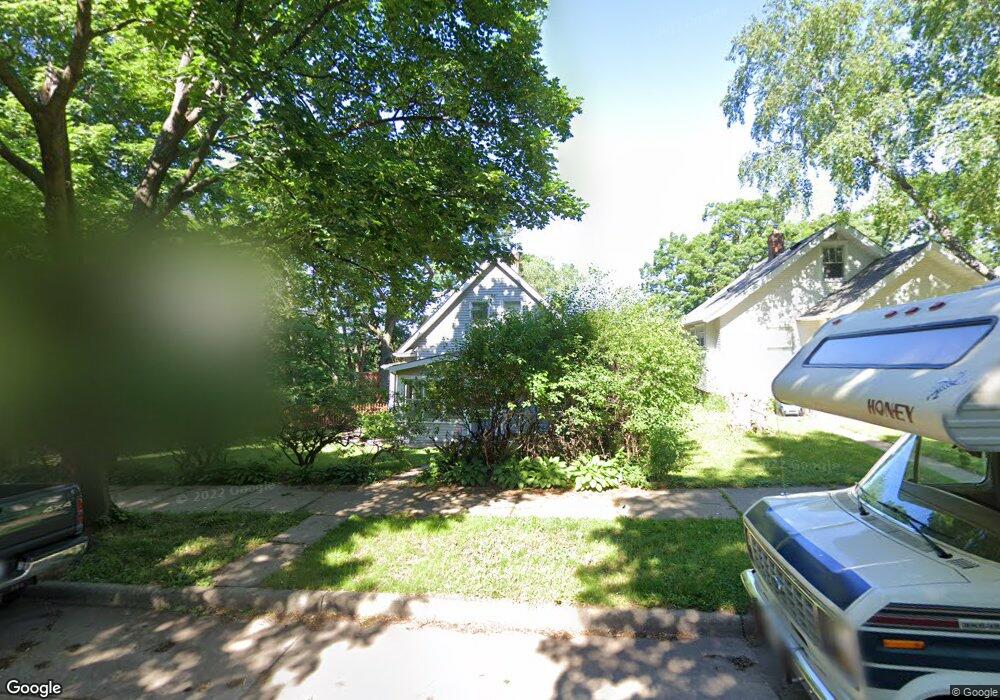
3012 Taylor St NE Minneapolis, MN 55418
Audubon Park NeighborhoodEstimated Value: $301,000 - $321,000
2
Beds
2
Baths
1,780
Sq Ft
$175/Sq Ft
Est. Value
About This Home
This home is located at 3012 Taylor St NE, Minneapolis, MN 55418 and is currently estimated at $312,114, approximately $175 per square foot. 3012 Taylor St NE is a home located in Hennepin County with nearby schools including Waite Park Elementary School, Northeast Middle School, and Thomas Edison High School.
Ownership History
Date
Name
Owned For
Owner Type
Purchase Details
Closed on
May 5, 2021
Sold by
Gainor Stephanie M and Kasemeotes Evan M
Bought by
El Ghazzawy Basil Sheikh and El Ghazzawy Abigail
Current Estimated Value
Home Financials for this Owner
Home Financials are based on the most recent Mortgage that was taken out on this home.
Original Mortgage
$279,300
Outstanding Balance
$253,116
Interest Rate
3.1%
Mortgage Type
New Conventional
Estimated Equity
$58,998
Purchase Details
Closed on
Sep 3, 2020
Sold by
Gainor Stephanie M and Kasemeotes Evan M
Bought by
Gainor Stephanie M and Kasemeotes Evan M
Purchase Details
Closed on
Jan 18, 2017
Sold by
Maland Timothy and Maland Alexandra
Bought by
Gainor Stephanie M and Kasemeotes Evan M
Home Financials for this Owner
Home Financials are based on the most recent Mortgage that was taken out on this home.
Original Mortgage
$203,250
Interest Rate
3.75%
Mortgage Type
FHA
Purchase Details
Closed on
Apr 9, 2010
Sold by
Kirkwold Violet L
Bought by
Maland Timothy
Create a Home Valuation Report for This Property
The Home Valuation Report is an in-depth analysis detailing your home's value as well as a comparison with similar homes in the area
Home Values in the Area
Average Home Value in this Area
Purchase History
| Date | Buyer | Sale Price | Title Company |
|---|---|---|---|
| El Ghazzawy Basil Sheikh | $300,000 | Edina Realty Title Inc | |
| Gainor Stephanie M | -- | None Listed On Document | |
| Gainor Stephanie M | $207,000 | Burnet Title | |
| Maland Timothy | $144,875 | -- |
Source: Public Records
Mortgage History
| Date | Status | Borrower | Loan Amount |
|---|---|---|---|
| Open | El Ghazzawy Basil Sheikh | $279,300 | |
| Previous Owner | Gainor Stephanie M | $203,250 |
Source: Public Records
Tax History Compared to Growth
Tax History
| Year | Tax Paid | Tax Assessment Tax Assessment Total Assessment is a certain percentage of the fair market value that is determined by local assessors to be the total taxable value of land and additions on the property. | Land | Improvement |
|---|---|---|---|---|
| 2024 | $3,748 | $272,000 | $129,000 | $143,000 |
| 2023 | $3,541 | $282,000 | $129,000 | $153,000 |
| 2022 | $3,175 | $254,000 | $92,000 | $162,000 |
| 2021 | $3,061 | $243,000 | $70,000 | $173,000 |
| 2020 | $3,210 | $242,500 | $55,400 | $187,100 |
| 2019 | $2,963 | $235,500 | $45,000 | $190,500 |
| 2018 | $2,579 | $214,000 | $45,000 | $169,000 |
| 2017 | $2,125 | $158,000 | $40,900 | $117,100 |
| 2016 | $1,949 | $143,500 | $40,900 | $102,600 |
| 2015 | $1,966 | $139,000 | $40,900 | $98,100 |
| 2014 | -- | $132,500 | $40,900 | $91,600 |
Source: Public Records
Map
Nearby Homes
- 2943 Taylor St NE
- 3049 Tyler St NE
- 3050 Pierce St NE
- 2922 Tyler St NE
- 1111 28th Ave NE
- 3227 Tyler St NE
- 3154 Lincoln St NE
- 3243 Pierce St NE
- 2637 Taylor St NE
- 2635 Polk St NE
- 2623 Polk St NE
- 2807 Ulysses St NE
- 2730 Ulysses St NE
- 1001 26th Ave NE
- 2827 Hayes St NE
- 3027 Garfield St NE
- 1014 26th Ave NE
- 1000 26th Ave NE
- 3438 Taylor St NE
- 2619 Lincoln St NE
- 3016 Taylor St NE
- 3004 Taylor St NE
- 3020 Taylor St NE
- 3000 Taylor St NE
- 3024 Taylor St NE
- 3011 Polk St NE
- 3009 Polk St NE
- 3017 Polk St NE
- 3005 Polk St NE
- 3021 Polk St NE
- 3025 Polk St NE
- 3013 Taylor St NE
- 3040 Taylor St NE
- 3009 Taylor St NE
- 3017 Taylor St NE
- 2958 Taylor St NE
- 3001 Taylor St NE
- 3029 Polk St NE
- 3023 Taylor St NE
- 2954 Taylor St NE