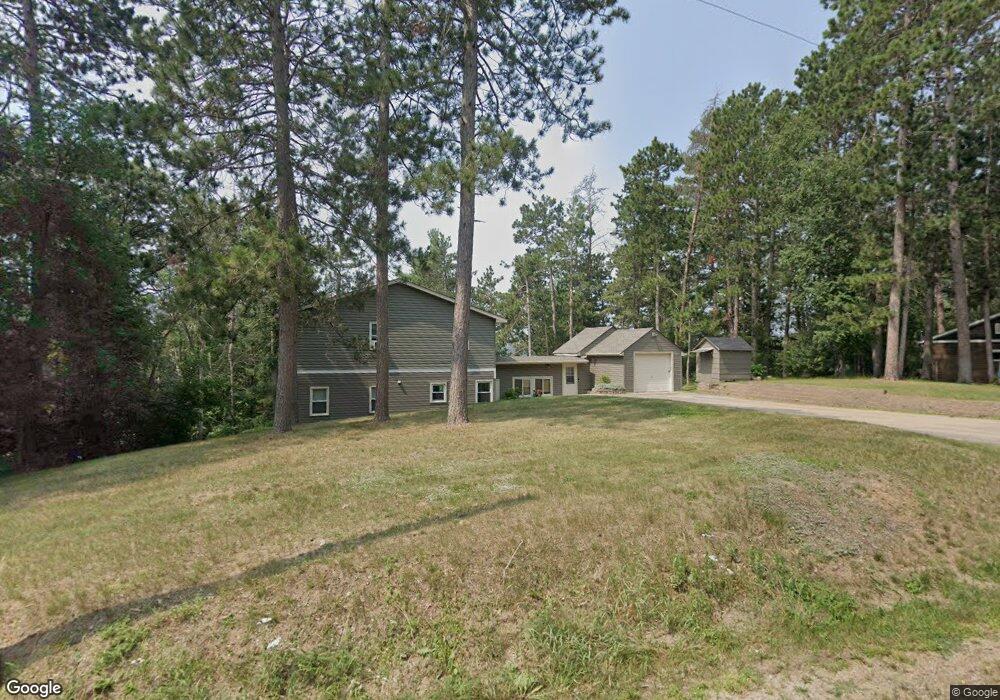
30125 Pequot Blvd Pequot Lakes, MN 56472
Estimated Value: $389,000 - $466,000
3
Beds
2
Baths
1,492
Sq Ft
$298/Sq Ft
Est. Value
About This Home
This home is located at 30125 Pequot Blvd, Pequot Lakes, MN 56472 and is currently estimated at $444,082, approximately $297 per square foot. 30125 Pequot Blvd is a home located in Crow Wing County with nearby schools including Eagle View Elementary School, Pequot Lakes Middle School, and Pequot Lakes Senior High School.
Ownership History
Date
Name
Owned For
Owner Type
Purchase Details
Closed on
Oct 18, 2022
Sold by
Besser Jon and Williams Kathy
Bought by
Iroezi Ngozi
Current Estimated Value
Home Financials for this Owner
Home Financials are based on the most recent Mortgage that was taken out on this home.
Original Mortgage
$398,700
Outstanding Balance
$382,628
Interest Rate
5.66%
Mortgage Type
New Conventional
Estimated Equity
$61,454
Purchase Details
Closed on
Oct 7, 2020
Sold by
Tucci Michael Michael
Bought by
Williams Kathy Kathy
Home Financials for this Owner
Home Financials are based on the most recent Mortgage that was taken out on this home.
Original Mortgage
$168,000
Interest Rate
2.88%
Purchase Details
Closed on
Mar 28, 2017
Sold by
Kittleson William L and Kittleson Lisa M
Bought by
Tucci Michael J
Create a Home Valuation Report for This Property
The Home Valuation Report is an in-depth analysis detailing your home's value as well as a comparison with similar homes in the area
Home Values in the Area
Average Home Value in this Area
Purchase History
| Date | Buyer | Sale Price | Title Company |
|---|---|---|---|
| Iroezi Ngozi | $443,000 | -- | |
| Williams Kathy Kathy | $210,000 | -- | |
| Tucci Michael J | $171,000 | -- |
Source: Public Records
Mortgage History
| Date | Status | Borrower | Loan Amount |
|---|---|---|---|
| Open | Iroezi Ngozi | $398,700 | |
| Previous Owner | Williams Kathy Kathy | $168,000 |
Source: Public Records
Tax History Compared to Growth
Tax History
| Year | Tax Paid | Tax Assessment Tax Assessment Total Assessment is a certain percentage of the fair market value that is determined by local assessors to be the total taxable value of land and additions on the property. | Land | Improvement |
|---|---|---|---|---|
| 2025 | $3,130 | $321,900 | $128,100 | $193,800 |
| 2024 | $3,130 | $293,100 | $114,200 | $178,900 |
| 2023 | $1,964 | $271,700 | $76,800 | $194,900 |
| 2022 | $1,774 | $197,300 | $51,900 | $145,400 |
| 2021 | $1,512 | $153,700 | $47,900 | $105,800 |
| 2020 | $1,566 | $141,900 | $54,200 | $87,700 |
| 2019 | $1,342 | $143,900 | $57,100 | $86,800 |
| 2018 | $1,278 | $124,600 | $51,400 | $73,200 |
| 2017 | $1,224 | $97,915 | $41,663 | $56,252 |
| 2016 | $1,092 | $80,700 | $35,700 | $45,000 |
| 2015 | $1,314 | $108,200 | $61,900 | $46,300 |
| 2014 | $596 | $103,500 | $57,300 | $46,200 |
Source: Public Records
Map
Nearby Homes
- 30395 Pequot Blvd
- Pillsbury and Lilac Xx
- 29939 Patriot Ave
- Lot 2 Patriot Ave
- Lot 4 Patriot Ave
- Lot 1 Patriot Ave
- 30795 Rasmussen Rd
- 30862 Rasmussen Rd
- TBD Dodder Ln SW
- 30957 Rasmussen Rd
- TBD Wildlife Trail
- 31167 N Heath St
- TBD Mayo Lake Ln
- 4084 W Grove St
- 3649 County Road 168
- 31418 Isabelle Dr
- 31423 Isabelle Dr
- 31468 Isabelle Dr
- 30850 Firewatch Way
- 30859 Firewatch Way
- 30141 Pequot Blvd
- 3961 Nelson St
- 3960 Nelson St
- 30167 Pequot Blvd
- 30167 Pequot Blvd
- TBD Nelson St
- 30069 Pequot Blvd
- 3972 Nelson St
- 3972 Nelson St
- 3989 Nelson St
- 3989 Nelson St
- 4046 Nelson St
- 30034 Pequot Blvd
- 30025 Pequot Blvd
- 30238 S Oak St
- 30238 S Oak St
- 30219 S Oak St
- XXX Nelson St
- xxxx Nelson St
- 3964 Mcgill St