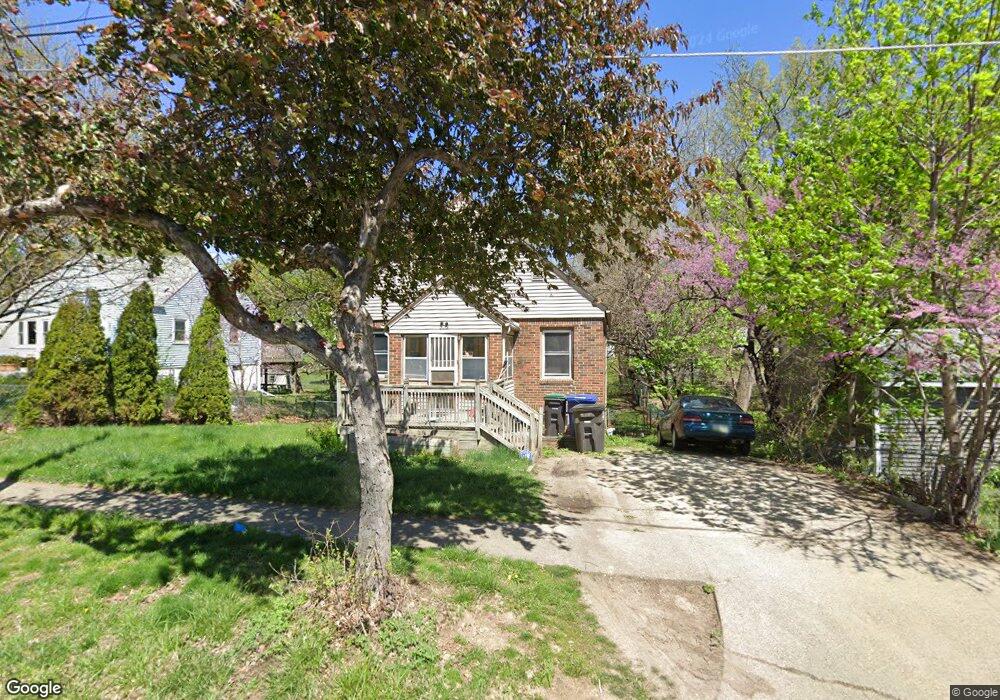
3013 Holcomb Ave Des Moines, IA 50310
Beaverdale NeighborhoodEstimated Value: $209,000 - $225,000
3
Beds
2
Baths
1,018
Sq Ft
$213/Sq Ft
Est. Value
About This Home
This home is located at 3013 Holcomb Ave, Des Moines, IA 50310 and is currently estimated at $216,548, approximately $212 per square foot. 3013 Holcomb Ave is a home located in Polk County with nearby schools including Monroe Elementary School, Meredith Middle School, and Hoover High School.
Ownership History
Date
Name
Owned For
Owner Type
Purchase Details
Closed on
Mar 27, 2018
Sold by
Boyd Jessica L and Boyd Jessica
Bought by
Boyd Jessica and Tison Shawn
Current Estimated Value
Purchase Details
Closed on
Apr 20, 2005
Sold by
Hash Lacey A
Bought by
Boyd Jessica L and Wilson Nicholas J
Home Financials for this Owner
Home Financials are based on the most recent Mortgage that was taken out on this home.
Original Mortgage
$92,720
Outstanding Balance
$54,493
Interest Rate
7.99%
Mortgage Type
Fannie Mae Freddie Mac
Estimated Equity
$162,055
Purchase Details
Closed on
Dec 26, 2001
Sold by
Nigro Michael L and Nigro Danielle Marie
Bought by
Hash Lacey A
Home Financials for this Owner
Home Financials are based on the most recent Mortgage that was taken out on this home.
Original Mortgage
$99,439
Interest Rate
6.53%
Mortgage Type
FHA
Purchase Details
Closed on
Dec 28, 1999
Sold by
Thoen Charles
Bought by
Nigro Michael L and Talario Danielle M
Home Financials for this Owner
Home Financials are based on the most recent Mortgage that was taken out on this home.
Original Mortgage
$76,271
Interest Rate
7.69%
Mortgage Type
FHA
Create a Home Valuation Report for This Property
The Home Valuation Report is an in-depth analysis detailing your home's value as well as a comparison with similar homes in the area
Home Values in the Area
Average Home Value in this Area
Purchase History
| Date | Buyer | Sale Price | Title Company |
|---|---|---|---|
| Boyd Jessica | -- | Stewart Title Company | |
| Boyd Jessica L | $115,500 | -- | |
| Hash Lacey A | $101,500 | -- | |
| Nigro Michael L | $76,500 | -- |
Source: Public Records
Mortgage History
| Date | Status | Borrower | Loan Amount |
|---|---|---|---|
| Open | Boyd Jessica L | $92,720 | |
| Previous Owner | Hash Lacey A | $99,439 | |
| Previous Owner | Nigro Michael L | $76,271 |
Source: Public Records
Tax History Compared to Growth
Tax History
| Year | Tax Paid | Tax Assessment Tax Assessment Total Assessment is a certain percentage of the fair market value that is determined by local assessors to be the total taxable value of land and additions on the property. | Land | Improvement |
|---|---|---|---|---|
| 2025 | $3,574 | $211,800 | $49,200 | $162,600 |
| 2024 | $3,574 | $192,100 | $44,500 | $147,600 |
| 2023 | $3,526 | $192,100 | $44,500 | $147,600 |
| 2022 | $3,498 | $158,500 | $38,500 | $120,000 |
| 2021 | $3,376 | $158,500 | $38,500 | $120,000 |
| 2020 | $3,502 | $143,900 | $35,200 | $108,700 |
| 2019 | $3,230 | $143,900 | $35,200 | $108,700 |
| 2018 | $3,104 | $128,700 | $30,800 | $97,900 |
| 2017 | $2,840 | $128,700 | $30,800 | $97,900 |
| 2016 | $2,760 | $116,800 | $27,500 | $89,300 |
| 2015 | $2,760 | $116,800 | $27,500 | $89,300 |
| 2014 | $2,524 | $110,900 | $25,600 | $85,300 |
Source: Public Records
Map
Nearby Homes
- 3109 Holcomb Ave
- 2615 30th St
- 3112 Sheridan Ave
- 2513 33rd St
- 2823 Holcomb Ave
- 2730 Sheridan Ave
- 2207 33rd St
- 2742 Hickman Rd
- 3501 Sheridan Ave
- 3111 Lincoln Ave
- 2310 35th St
- 2701 27th St
- 3514 Urbandale Ave
- 2119 35th St
- 3016 30th St
- 2201 36th St
- 2620 Arnold Rd
- 2804 Boston Ave
- 2309 37th St
- 2210 36th St