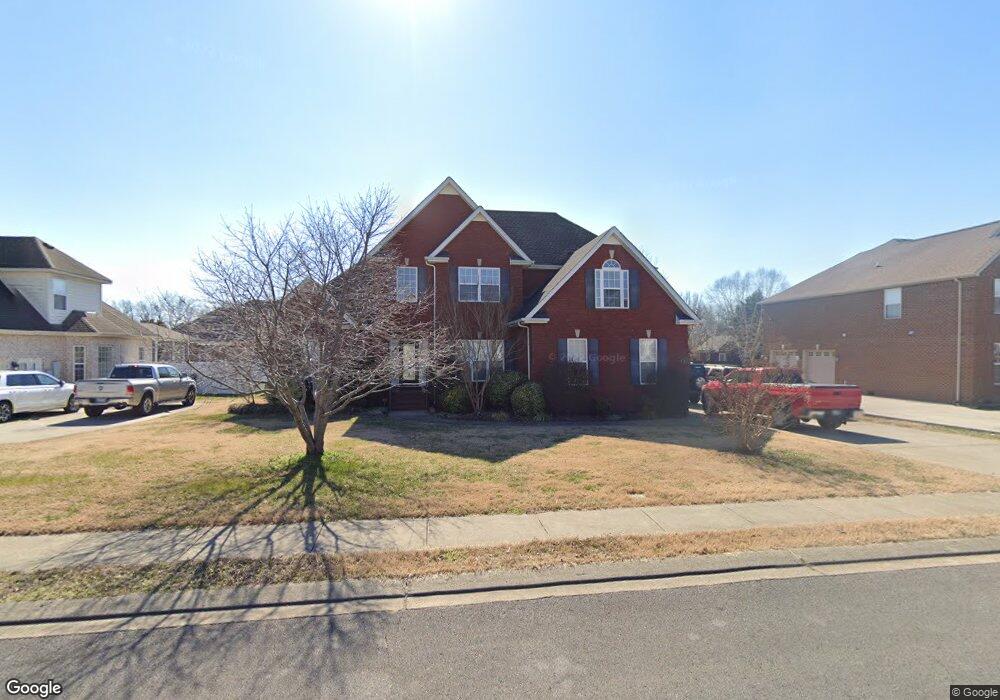
3013 Silver Springs Ct Murfreesboro, TN 37128
Estimated Value: $465,000 - $556,000
--
Bed
--
Bath
2,767
Sq Ft
$187/Sq Ft
Est. Value
About This Home
This home is located at 3013 Silver Springs Ct, Murfreesboro, TN 37128 and is currently estimated at $517,829, approximately $187 per square foot. 3013 Silver Springs Ct is a home located in Rutherford County with nearby schools including Salem Elementary School, Barfield Elementary School, and Rockvale Middle School.
Ownership History
Date
Name
Owned For
Owner Type
Purchase Details
Closed on
Jan 4, 2021
Sold by
Prisayane Khamphoung
Bought by
Prisayane Khamphoung and Prisayane Somsouk
Current Estimated Value
Purchase Details
Closed on
Jul 8, 2014
Sold by
Sivongxay Gary T
Bought by
Prisayane Rostum Khamphoung
Purchase Details
Closed on
Jul 9, 2012
Sold by
Arinhakoune Keoudone
Bought by
Sivongxay Gary T
Home Financials for this Owner
Home Financials are based on the most recent Mortgage that was taken out on this home.
Original Mortgage
$150,100
Interest Rate
3.7%
Mortgage Type
Commercial
Purchase Details
Closed on
Oct 11, 2005
Sold by
Devault Home Imvprovements
Bought by
Keooudone Arinhakoune
Home Financials for this Owner
Home Financials are based on the most recent Mortgage that was taken out on this home.
Original Mortgage
$170,000
Interest Rate
5.71%
Mortgage Type
Purchase Money Mortgage
Create a Home Valuation Report for This Property
The Home Valuation Report is an in-depth analysis detailing your home's value as well as a comparison with similar homes in the area
Home Values in the Area
Average Home Value in this Area
Purchase History
| Date | Buyer | Sale Price | Title Company |
|---|---|---|---|
| Prisayane Khamphoung | -- | None Available | |
| Prisayane Rostum Khamphoung | -- | -- | |
| Sivongxay Gary T | $193,000 | -- | |
| Keooudone Arinhakoune | $269,900 | -- |
Source: Public Records
Mortgage History
| Date | Status | Borrower | Loan Amount |
|---|---|---|---|
| Previous Owner | Sivongxay Gary T | $150,100 | |
| Previous Owner | Keooudone Arinhakoune | $170,000 |
Source: Public Records
Tax History Compared to Growth
Tax History
| Year | Tax Paid | Tax Assessment Tax Assessment Total Assessment is a certain percentage of the fair market value that is determined by local assessors to be the total taxable value of land and additions on the property. | Land | Improvement |
|---|---|---|---|---|
| 2025 | $3,207 | $113,375 | $13,750 | $99,625 |
| 2024 | $3,207 | $113,375 | $13,750 | $99,625 |
| 2023 | $2,060 | $109,775 | $13,750 | $96,025 |
| 2022 | $1,774 | $109,775 | $13,750 | $96,025 |
| 2021 | $1,701 | $76,650 | $12,500 | $64,150 |
| 2020 | $1,701 | $76,650 | $12,500 | $64,150 |
| 2019 | $1,701 | $76,650 | $12,500 | $64,150 |
Source: Public Records
Map
Nearby Homes
- 3002 Stow Crossing
- 2732 Avington Ct
- 3736 Jerry Anderson Dr
- 3111 Monrovia Dr
- 2910 Morning Mist Ct
- 3708 Jerry Anderson Dr
- 2812 Ruland Place
- 2819 Silver Springs Ct
- 2818 Silver Springs Ct
- 3633 Jerry Anderson
- 3640 Shady Forest Dr
- 3121 Castleton Dr
- 3625 Shady Forest Dr
- 3032 Morning Mist Ct
- 3613 Shady Forest Dr
- 3605 Shady Forest Dr
- 3633 Capstone Dr
- 3636 Pelham Wood Dr
- 3628 Pelham Wood Dr
- 3206 Holderwood Dr
- 3009 Silver Springs Ct
- 3017 Silver Springs Ct
- 3304 Sulphur Springs Rd
- 3006 Stow Crossing
- 3014 Stow Crossing
- 3005 Silver Springs Ct
- 3012 Silver Springs Ct
- 3021 Silver Springs Ct
- 3016 Silver Springs Ct
- 3008 Silver Springs Ct
- 3018 Stow Crossing
- 3020 Silver Springs Ct
- 3025 Silver Springs Ct
- 3022 Stow Crossing
- 3029 Silver Springs Ct
- 3011 Spottswood Cir
- 3015 Stow Crossing
- 3015 Spottswood Cir
- 3007 Spottswood Cir
- 3011 Stow Crossing