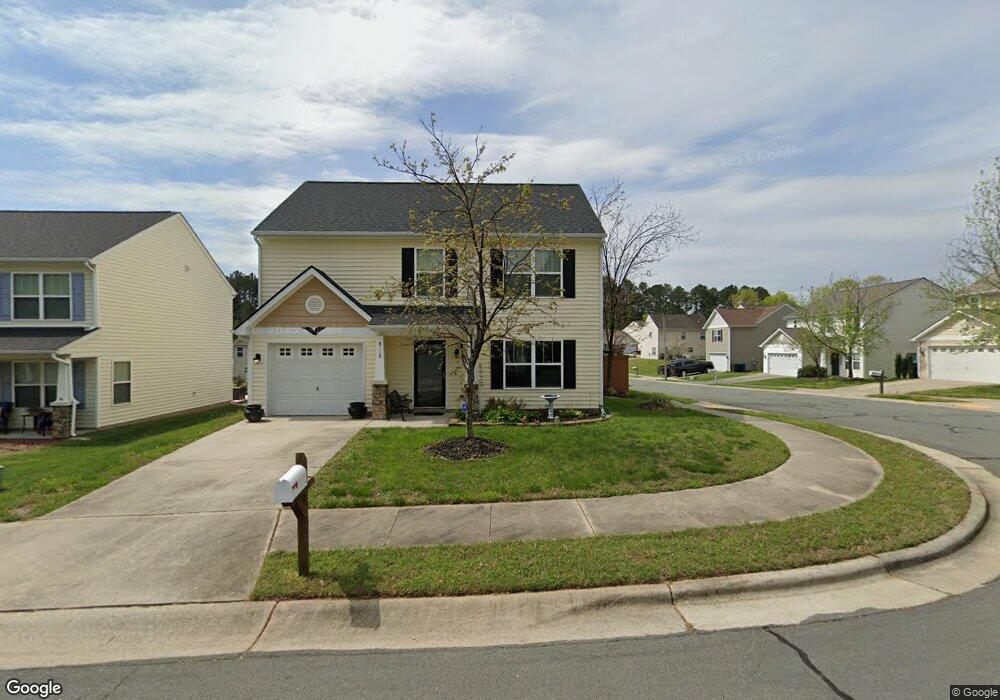
3013 Stone Fence Ct Durham, NC 27704
Northeast Durham NeighborhoodEstimated Value: $347,000 - $375,000
3
Beds
3
Baths
1,608
Sq Ft
$223/Sq Ft
Est. Value
About This Home
This home is located at 3013 Stone Fence Ct, Durham, NC 27704 and is currently estimated at $358,388, approximately $222 per square foot. 3013 Stone Fence Ct is a home located in Durham County with nearby schools including Glenn Elementary, John W Neal Middle School, and Southern School of Energy & Sustainability.
Ownership History
Date
Name
Owned For
Owner Type
Purchase Details
Closed on
Nov 26, 2008
Sold by
Cimarron Capital Inc
Bought by
Parker James Cleveland and Parker April Smith
Current Estimated Value
Home Financials for this Owner
Home Financials are based on the most recent Mortgage that was taken out on this home.
Original Mortgage
$100,000
Outstanding Balance
$65,978
Interest Rate
6.1%
Mortgage Type
Purchase Money Mortgage
Estimated Equity
$292,410
Purchase Details
Closed on
Sep 17, 2008
Sold by
Panther Creek Of Durham Llc
Bought by
Cimarron Capital Inc
Home Financials for this Owner
Home Financials are based on the most recent Mortgage that was taken out on this home.
Original Mortgage
$119,988
Interest Rate
6.49%
Mortgage Type
Construction
Create a Home Valuation Report for This Property
The Home Valuation Report is an in-depth analysis detailing your home's value as well as a comparison with similar homes in the area
Home Values in the Area
Average Home Value in this Area
Purchase History
| Date | Buyer | Sale Price | Title Company |
|---|---|---|---|
| Parker James Cleveland | $145,000 | None Available | |
| Cimarron Capital Inc | $33,000 | None Available |
Source: Public Records
Mortgage History
| Date | Status | Borrower | Loan Amount |
|---|---|---|---|
| Open | Parker James Cleveland | $100,000 | |
| Previous Owner | Cimarron Capital Inc | $119,988 |
Source: Public Records
Tax History Compared to Growth
Tax History
| Year | Tax Paid | Tax Assessment Tax Assessment Total Assessment is a certain percentage of the fair market value that is determined by local assessors to be the total taxable value of land and additions on the property. | Land | Improvement |
|---|---|---|---|---|
| 2025 | $2,535 | $334,153 | $73,125 | $261,028 |
| 2024 | $2,535 | $181,736 | $35,100 | $146,636 |
| 2023 | $2,381 | $181,736 | $35,100 | $146,636 |
| 2022 | $2,326 | $181,736 | $35,100 | $146,636 |
| 2021 | $2,315 | $181,736 | $35,100 | $146,636 |
| 2020 | $2,261 | $181,736 | $35,100 | $146,636 |
| 2019 | $2,261 | $181,736 | $35,100 | $146,636 |
| 2018 | $2,048 | $150,990 | $29,250 | $121,740 |
| 2017 | $2,033 | $150,990 | $29,250 | $121,740 |
| 2016 | $1,965 | $150,990 | $29,250 | $121,740 |
| 2015 | $2,296 | $165,873 | $32,015 | $133,858 |
| 2014 | $2,296 | $165,873 | $32,015 | $133,858 |
Source: Public Records
Map
Nearby Homes
- 2810 Catamount Ct
- 2901 Burton Rd
- 2651 Burton Rd
- 1212 Carpenter Falls Ave
- 2925 Redwood Rd
- 1204 Carpenter Falls Ave
- 1214 Carpenter Falls Ave
- 1102 Carpenter Falls Ave
- 1106 Carpenter Falls Ave
- 1216 Carpenter Falls Ave
- 1305 Carpenter Falls Ave
- 1215 Carpenter Falls Ave
- 1200 Carpenter Falls Ave
- 1202 Carpenter Falls Ave
- 1112 Carpenter Falls Ave
- 1110 Carpenter Falls Ave
- 118 Truss Way
- 4103 Cheek Rd
- 4300-4304 Cheek Rd
- 3003 Hammer Creek Rd
- 3011 Stone Fence Ct
- 3009 Stone Fence Ct
- 4403 Broomstraw Ct
- 2512 Tulip Poplar Cir
- 4405 Broomstraw Ct
- 4405 Broomstraw Ct
- 2510 Tulip Poplar Cir
- 4401 Broomstraw Ct
- 3007 Stone Fence Ct
- 3012 Stone Fence Ct
- 2508 Tulip Poplar Cir
- 3010 Stone Fence Ct
- 4303 Broomstraw Ct
- 4407 Broomstraw Ct
- 2506 Tulip Poplar Cir
- 3005 Stone Fence Ct
- 2602 Tulip Poplar Cir
- 4301 Broomstraw Ct
- 2935 Cherrybark Dr
- 3006 Stone Fence Ct