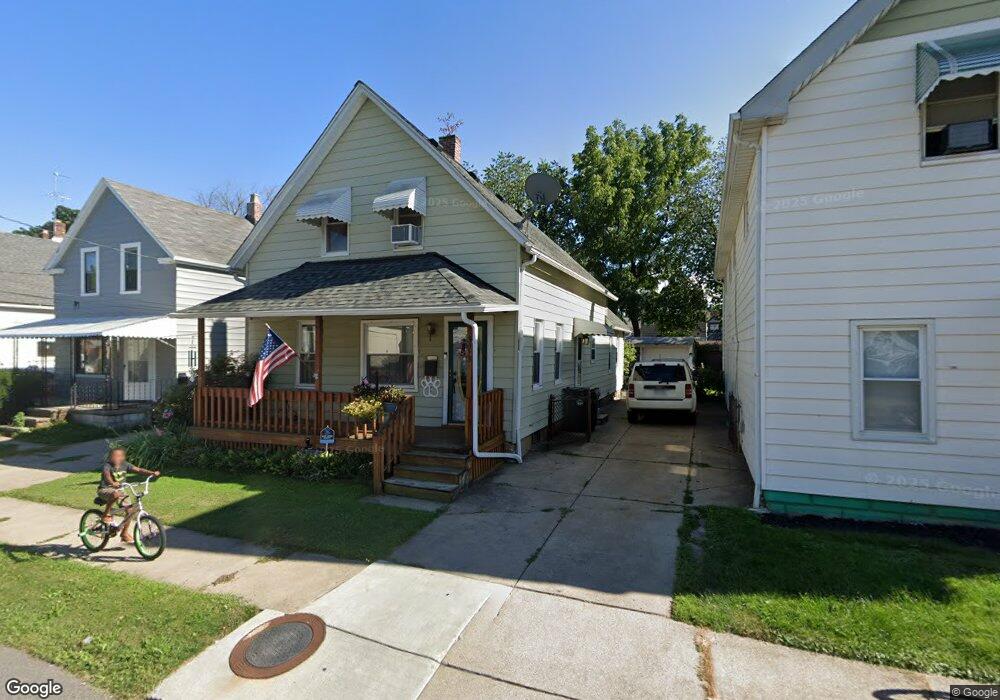
3013 Tampa Ave Cleveland, OH 44109
Old Brooklyn NeighborhoodEstimated Value: $118,062 - $153,000
2
Beds
1
Bath
1,056
Sq Ft
$123/Sq Ft
Est. Value
About This Home
This home is located at 3013 Tampa Ave, Cleveland, OH 44109 and is currently estimated at $129,516, approximately $122 per square foot. 3013 Tampa Ave is a home located in Cuyahoga County with nearby schools including Benjamin Franklin, Almira Academy, and Artemus Ward School.
Ownership History
Date
Name
Owned For
Owner Type
Purchase Details
Closed on
Jan 17, 2002
Sold by
Farruggia Eugene
Bought by
Farruggia Eugene and Farruggia Mary Jo
Current Estimated Value
Home Financials for this Owner
Home Financials are based on the most recent Mortgage that was taken out on this home.
Original Mortgage
$68,800
Interest Rate
6.69%
Mortgage Type
Balloon
Purchase Details
Closed on
Feb 24, 1988
Sold by
Farruggia Eugene and Mary Jo
Bought by
Farruggia Eugene
Purchase Details
Closed on
Oct 11, 1983
Sold by
Grugle Edward
Bought by
Farruggia Eugene and Mary Jo
Purchase Details
Closed on
Oct 13, 1982
Sold by
Edward Grugle
Bought by
Grugle Edward and Grugle Dorothy
Purchase Details
Closed on
Sep 25, 1978
Sold by
Grugle Edw and Grugle Dorothy
Bought by
Edward Grugle
Purchase Details
Closed on
Jan 1, 1975
Bought by
Grugle Edw and Grugle Dorothy
Create a Home Valuation Report for This Property
The Home Valuation Report is an in-depth analysis detailing your home's value as well as a comparison with similar homes in the area
Home Values in the Area
Average Home Value in this Area
Purchase History
| Date | Buyer | Sale Price | Title Company |
|---|---|---|---|
| Farruggia Eugene | -- | Southern Title Company | |
| Farruggia Eugene | -- | -- | |
| Farruggia Eugene | $34,000 | -- | |
| Grugle Edward | -- | -- | |
| Grugle Edward | -- | -- | |
| Edward Grugle | -- | -- | |
| Grugle Edw | -- | -- |
Source: Public Records
Mortgage History
| Date | Status | Borrower | Loan Amount |
|---|---|---|---|
| Closed | Farruggia Eugene | $68,800 | |
| Closed | Farruggia Eugene | $17,000 |
Source: Public Records
Tax History Compared to Growth
Tax History
| Year | Tax Paid | Tax Assessment Tax Assessment Total Assessment is a certain percentage of the fair market value that is determined by local assessors to be the total taxable value of land and additions on the property. | Land | Improvement |
|---|---|---|---|---|
| 2024 | $2,456 | $37,450 | $7,175 | $30,275 |
| 2023 | $1,732 | $22,830 | $4,940 | $17,890 |
| 2022 | $1,722 | $22,820 | $4,940 | $17,890 |
| 2021 | $1,704 | $22,820 | $4,940 | $17,890 |
| 2020 | $1,527 | $17,680 | $3,820 | $13,860 |
| 2019 | $1,412 | $50,500 | $10,900 | $39,600 |
| 2018 | $1,407 | $17,680 | $3,820 | $13,860 |
| 2017 | $1,418 | $17,190 | $3,010 | $14,180 |
| 2016 | $1,407 | $17,190 | $3,010 | $14,180 |
| 2015 | $1,570 | $17,190 | $3,010 | $14,180 |
| 2014 | $1,570 | $19,120 | $3,330 | $15,790 |
Source: Public Records
Map
Nearby Homes
- 2815 Tampa Ave
- 2810 Natchez Ave
- 4491 W 30th St
- 3404 Cypress Ave
- 3301 Hillcrest Ave
- 3513 Dawning Ave
- 3514 Leopold Ave
- 3616 Cecilia Ave
- 2219 Hood Ave
- 3704 Dawning Ave
- 2312 Roanoke Ave Unit 1-2
- 3908 Behrwald Ave
- 3909 Behrwald Ave
- 2101 Broadview Rd
- 2802 Colburn Ave
- 2018 Tampa Ave
- 3816 Bucyrus Ave
- 4302 W 30th St
- 1917 Cypress Ave
- 4295 W 30th St
- 3009 Tampa Ave
- 3015 Tampa Ave
- 3005 Tampa Ave
- 3019 Tampa Ave
- 3003 Tampa Ave
- 3103 Tampa Ave
- 3010 Saratoga Ave
- 3006 Saratoga Ave
- 3012 Saratoga Ave
- 3002 Saratoga Ave
- 3014 Tampa Ave
- 3014 3016 Tampa Ave
- 3016 Saratoga Ave
- 2920 Saratoga Ave
- 3105 Tampa Ave
- 3012 Tampa Ave
- 3010 Tampa Ave
- 3024 Saratoga Ave
- 2914 Saratoga Ave
- 3006 Tampa Ave