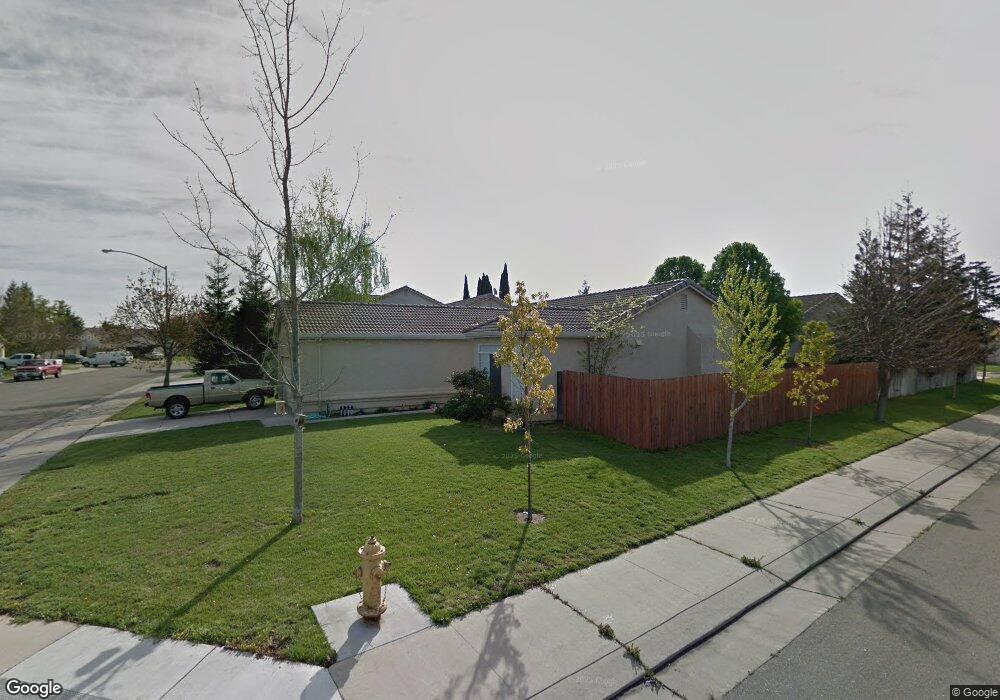
3014 Ginkgo Ct Stockton, CA 95212
Estimated Value: $267,000 - $457,000
3
Beds
2
Baths
1,350
Sq Ft
$299/Sq Ft
Est. Value
About This Home
This home is located at 3014 Ginkgo Ct, Stockton, CA 95212 and is currently estimated at $403,070, approximately $298 per square foot. 3014 Ginkgo Ct is a home located in San Joaquin County with nearby schools including Valentine Peyton Elementary School, George W. Bush Elementary School, and Rio Calaveras Elementary School.
Ownership History
Date
Name
Owned For
Owner Type
Purchase Details
Closed on
Mar 15, 2011
Sold by
Federal National Mortgage Association
Bought by
Diaz Ivan
Current Estimated Value
Home Financials for this Owner
Home Financials are based on the most recent Mortgage that was taken out on this home.
Original Mortgage
$134,501
Interest Rate
4.87%
Mortgage Type
FHA
Purchase Details
Closed on
Oct 13, 2010
Sold by
Abrescy Glenn R and Abrescy Cynthia R
Bought by
Federal National Mortgage Association
Purchase Details
Closed on
Dec 20, 1996
Sold by
Arnaiz Development Co Inc
Bought by
Abrescy Glenn R and Abrescy Cynthia R
Home Financials for this Owner
Home Financials are based on the most recent Mortgage that was taken out on this home.
Original Mortgage
$111,094
Interest Rate
7.59%
Mortgage Type
FHA
Create a Home Valuation Report for This Property
The Home Valuation Report is an in-depth analysis detailing your home's value as well as a comparison with similar homes in the area
Home Values in the Area
Average Home Value in this Area
Purchase History
| Date | Buyer | Sale Price | Title Company |
|---|---|---|---|
| Diaz Ivan | $138,000 | Stewart Title Of California | |
| Federal National Mortgage Association | $325,602 | None Available | |
| Abrescy Glenn R | $113,000 | First American Title Co |
Source: Public Records
Mortgage History
| Date | Status | Borrower | Loan Amount |
|---|---|---|---|
| Previous Owner | Diaz Ivan | $134,501 | |
| Previous Owner | Abrescy Glenn R | $111,094 |
Source: Public Records
Tax History Compared to Growth
Tax History
| Year | Tax Paid | Tax Assessment Tax Assessment Total Assessment is a certain percentage of the fair market value that is determined by local assessors to be the total taxable value of land and additions on the property. | Land | Improvement |
|---|---|---|---|---|
| 2025 | $2,602 | $189,105 | $43,554 | $145,551 |
| 2024 | $2,543 | $185,398 | $42,700 | $142,698 |
| 2023 | $2,471 | $181,763 | $41,863 | $139,900 |
| 2022 | $2,413 | $178,200 | $41,043 | $137,157 |
| 2021 | $2,314 | $174,707 | $40,239 | $134,468 |
| 2020 | $2,355 | $172,917 | $39,827 | $133,090 |
| 2019 | $2,317 | $169,528 | $39,047 | $130,481 |
| 2018 | $2,276 | $166,205 | $38,282 | $127,923 |
| 2017 | $2,164 | $162,947 | $37,532 | $125,415 |
| 2016 | $2,201 | $159,753 | $36,797 | $122,956 |
| 2014 | $2,230 | $154,271 | $35,534 | $118,737 |
Source: Public Records
Map
Nearby Homes
- 2709 Etcheverry Dr
- 5250 Foxglove Ct
- 2321 Bartram Run Way
- 2330 Pinetown St
- 4437 Harmony Hill Way
- 5431 Strawberry Way
- 4503 White Forge Dr
- 5718 Krissi Ct
- 2815 Keyser Dr
- 1750 Bonaire Cir
- 2224 Big Oak Ct
- 2442 Brandywine Ct
- 5813 Fred Russo Dr
- 6130 Fred Russo Dr
- 4028 Trieste Cir
- 2036 Mighty Oak Dr
- 4900 N Highway 99 Unit 106
- 4900 N Highway 99 Unit 190
- 2312 E Stadium Dr
- 4705 Cayman Ct
- 3026 Ginkgo Ct
- 3003 Nyssa Ct
- 3042 Ginkgo Ct
- 2948 Rapid Brook Ct
- 3019 Nyssa Ct
- 2949 Bridge Cross Ct
- 3007 Ginkgo Ct
- 3023 Ginkgo Ct
- 3050 Ginkgo Ct
- 2940 Rapid Brook Ct
- 3037 Ginkgo Ct
- 3031 Nyssa Ct
- 2947 Rapid Brook Ct
- 2941 Bridge Cross Ct
- 3043 Ginkgo Ct
- 2932 Rapid Brook Ct
- 2939 Rapid Brook Ct
- 3051 Ginkgo Ct
- 4470 Wild Grape Dr
- 2933 Bridge Cross Ct