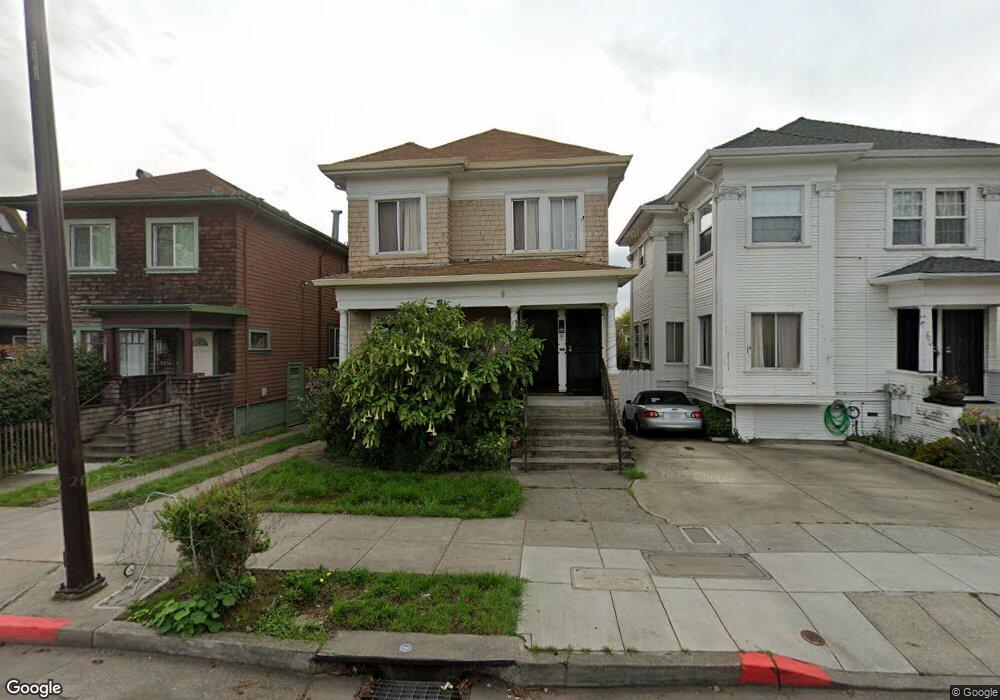
3014 Martin Luther King jr Way Berkeley, CA 94703
South Berkeley NeighborhoodEstimated Value: $1,156,000 - $2,017,000
--
Bed
--
Bath
2,164
Sq Ft
$669/Sq Ft
Est. Value
About This Home
This home is located at 3014 Martin Luther King jr Way, Berkeley, CA 94703 and is currently estimated at $1,447,363, approximately $668 per square foot. 3014 Martin Luther King jr Way is a home located in Alameda County with nearby schools including Malcolm X Elementary School, Emerson Elementary School, and John Muir Elementary School.
Ownership History
Date
Name
Owned For
Owner Type
Purchase Details
Closed on
Dec 28, 2018
Sold by
Johnson Dolores M
Bought by
Johnson Victor
Current Estimated Value
Purchase Details
Closed on
Jun 17, 1997
Sold by
Overton Edward and Overton Dorsie L
Bought by
Overton Edward and Overton Dorsie I
Home Financials for this Owner
Home Financials are based on the most recent Mortgage that was taken out on this home.
Original Mortgage
$137,200
Interest Rate
7.94%
Create a Home Valuation Report for This Property
The Home Valuation Report is an in-depth analysis detailing your home's value as well as a comparison with similar homes in the area
Home Values in the Area
Average Home Value in this Area
Purchase History
| Date | Buyer | Sale Price | Title Company |
|---|---|---|---|
| Johnson Victor | -- | Chicago Title Company | |
| Johnson Victor | -- | Chicago Title Company | |
| Overton Edward | -- | Golden California Title Co |
Source: Public Records
Mortgage History
| Date | Status | Borrower | Loan Amount |
|---|---|---|---|
| Closed | Overton Edward | $137,200 |
Source: Public Records
Tax History Compared to Growth
Tax History
| Year | Tax Paid | Tax Assessment Tax Assessment Total Assessment is a certain percentage of the fair market value that is determined by local assessors to be the total taxable value of land and additions on the property. | Land | Improvement |
|---|---|---|---|---|
| 2025 | $15,648 | $871,311 | $261,393 | $609,918 |
| 2024 | $15,648 | $854,230 | $256,269 | $597,961 |
| 2023 | $15,199 | $837,483 | $251,245 | $586,238 |
| 2022 | $14,782 | $821,061 | $246,318 | $574,743 |
| 2021 | $14,801 | $804,967 | $241,490 | $563,477 |
| 2020 | $14,000 | $796,716 | $239,015 | $557,701 |
| 2019 | $13,424 | $781,100 | $234,330 | $546,770 |
| 2018 | $13,165 | $765,787 | $229,736 | $536,051 |
| 2017 | $12,706 | $750,773 | $225,232 | $525,541 |
| 2016 | $12,295 | $736,055 | $220,816 | $515,239 |
| 2015 | $12,073 | $725,000 | $217,500 | $507,500 |
| 2014 | $4,990 | $144,250 | $43,275 | $100,975 |
Source: Public Records
Map
Nearby Homes
- 2946 Harper St
- 2057 Emerson St
- 2918 Newbury St
- 3038 Shattuck Ave
- 3050 Shattuck Ave
- 6525 Dover St
- 1628 Tyler St
- 2110 Ashby Ave
- 2051 Oregon St
- 3233 Ellis St
- 1614 Russell St
- 1538 Ashby Ave
- 2829 California St
- 2180 Ashby Ave
- 641 63rd St
- 3101 Sacramento St
- 3109 Sacramento St
- 669 Alcatraz Ave
- 667 & 667A Alcatraz Ave
- 667 Alcatraz Ave
- 3012 Martin Luther King jr Way
- 3018 Martin Luther King jr Way
- 3010 Marting Luther King
- 3010 Martin Luther King jr Way
- 3020 Martin Luther King jr Way
- 3006 Martin Luther King jr Way
- 3017 Harper St
- 3015 Harper St
- 3026 Martin Luther King jr Way
- 3041 Martin Luther King Junior Way
- 3009 Harper St
- 3019 Harper St
- 3004 Martin Luther King jr Way
- 3005 Harper St
- 3025 Harper St
- 3028 Martin Luther King jr Way
- 1888 Ashby Ave
- 3027 Harper St
- 3032 Martin Luther King jr Way
- 3033 Harper St