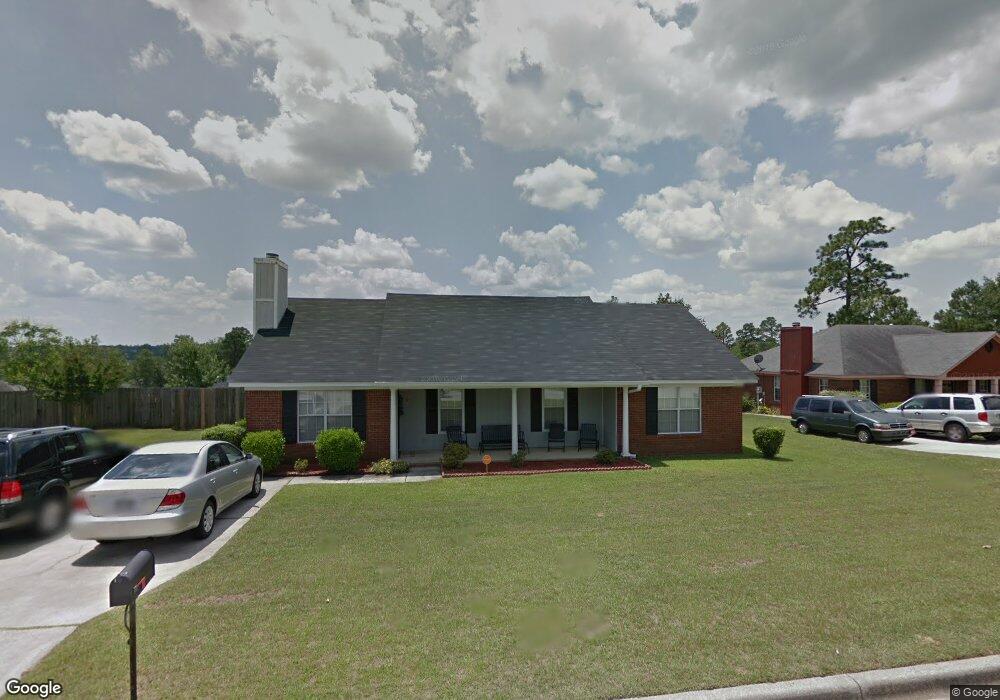
3014 Plumbridge Ct Hephzibah, GA 30815
Windsor Spring NeighborhoodEstimated Value: $204,725 - $222,000
4
Beds
2
Baths
1,619
Sq Ft
$133/Sq Ft
Est. Value
About This Home
This home is located at 3014 Plumbridge Ct, Hephzibah, GA 30815 and is currently estimated at $214,681, approximately $132 per square foot. 3014 Plumbridge Ct is a home located in Richmond County with nearby schools including R.B. Hunt Elementary School, Jamestown Elementary School, and Glenn Hills Middle School.
Ownership History
Date
Name
Owned For
Owner Type
Purchase Details
Closed on
Aug 28, 1996
Sold by
Housing & Urban Development Secretary Of
Bought by
Robinson Lavonya C
Current Estimated Value
Purchase Details
Closed on
Aug 21, 1996
Sold by
Housing & Urban Dev
Bought by
Robinson Lavonya C
Purchase Details
Closed on
Jun 3, 1996
Sold by
Chemical Residential Mortgage Corp
Bought by
Housing & Urban Development Secretary Of
Purchase Details
Closed on
Oct 3, 1995
Sold by
Chemical and Chemical Residentia
Bought by
Housing & Urban Dev
Purchase Details
Closed on
Sep 14, 1992
Sold by
Richmond Properties Inc
Bought by
Sheppard Thomasina
Purchase Details
Closed on
Sep 9, 1992
Sold by
Richmond Properties
Bought by
Sheppard Thomasina
Purchase Details
Closed on
Aug 15, 1991
Sold by
Quail Ridge Ltd Trc Development Corp T
Bought by
Lively C Milner
Purchase Details
Closed on
Jul 24, 1991
Sold by
Quail Ridge Ltd
Bought by
Lively C Milner
Create a Home Valuation Report for This Property
The Home Valuation Report is an in-depth analysis detailing your home's value as well as a comparison with similar homes in the area
Home Values in the Area
Average Home Value in this Area
Purchase History
| Date | Buyer | Sale Price | Title Company |
|---|---|---|---|
| Robinson Lavonya C | -- | -- | |
| Robinson Lavonya C | $72,000 | -- | |
| Housing & Urban Development Secretary Of | -- | -- | |
| Housing & Urban Dev | $91,400 | -- | |
| Sheppard Thomasina | -- | -- | |
| Sheppard Thomasina | $76,000 | -- | |
| Lively C Milner | -- | -- | |
| Lively C Milner | $136,000 | -- |
Source: Public Records
Tax History Compared to Growth
Tax History
| Year | Tax Paid | Tax Assessment Tax Assessment Total Assessment is a certain percentage of the fair market value that is determined by local assessors to be the total taxable value of land and additions on the property. | Land | Improvement |
|---|---|---|---|---|
| 2025 | $1,054 | $81,840 | $7,310 | $74,530 |
| 2024 | $1,054 | $72,636 | $7,310 | $65,326 |
| 2023 | $930 | $75,524 | $7,310 | $68,214 |
| 2022 | $868 | $55,608 | $7,310 | $48,298 |
| 2021 | $684 | $34,856 | $7,310 | $27,546 |
| 2020 | $687 | $34,856 | $7,310 | $27,546 |
| 2019 | $708 | $34,856 | $7,310 | $27,546 |
| 2018 | $710 | $34,856 | $7,310 | $27,546 |
| 2017 | $683 | $34,856 | $7,310 | $27,546 |
| 2016 | $683 | $34,856 | $7,310 | $27,546 |
| 2015 | $683 | $34,856 | $7,310 | $27,546 |
| 2014 | $1,341 | $34,700 | $7,310 | $27,390 |
Source: Public Records
Map
Nearby Homes
- 3510 Andover Dr
- 2818 Cranbrook Dr
- 3656 Woodcock Dr
- 3606 Monmouth Rd
- 3507 Mercedes Dr
- 2924 Algernon Cir
- 3512 Morgan Rd
- 3011 White Sand Dr
- 3621 Pebble Creek Dr
- 3623 Pebble Creek Dr
- 3629 Pebble Creek Dr
- 3627 Pebble Creek Dr
- 3625 Pebble Creek Dr
- 2813 Ridgecrest Dr
- 3753 Woodcock Dr
- 4004 Rambling Way
- 3526 Edmonton St
- 3603 Pebble Creek Dr
- 2655 Cranbrook Dr
- 3602 Pebble Creek Dr
- 3012 Plumbridge Ct
- 3016 Plumbridge Ct
- 2717 Crosshaven Dr
- 2719 Crosshaven Dr
- 2721 Crosshaven Dr
- 2715 Crosshaven Dr
- 3010 Plumbridge Ct
- 3007 Plumbridge Ct
- 2723 Crosshaven Dr
- 3009 Plumbridge Ct
- 3005 Plumbridge Ct
- 3011 Plumbridge Ct
- 2713 Crosshaven Dr
- 3008 Plumbridge Ct
- 2725 Crosshaven Dr
- 3003 Plumbridge Ct
- 2722 Crosshaven Dr
- 2727 Crosshaven Dr
- 2711 Crosshaven Dr