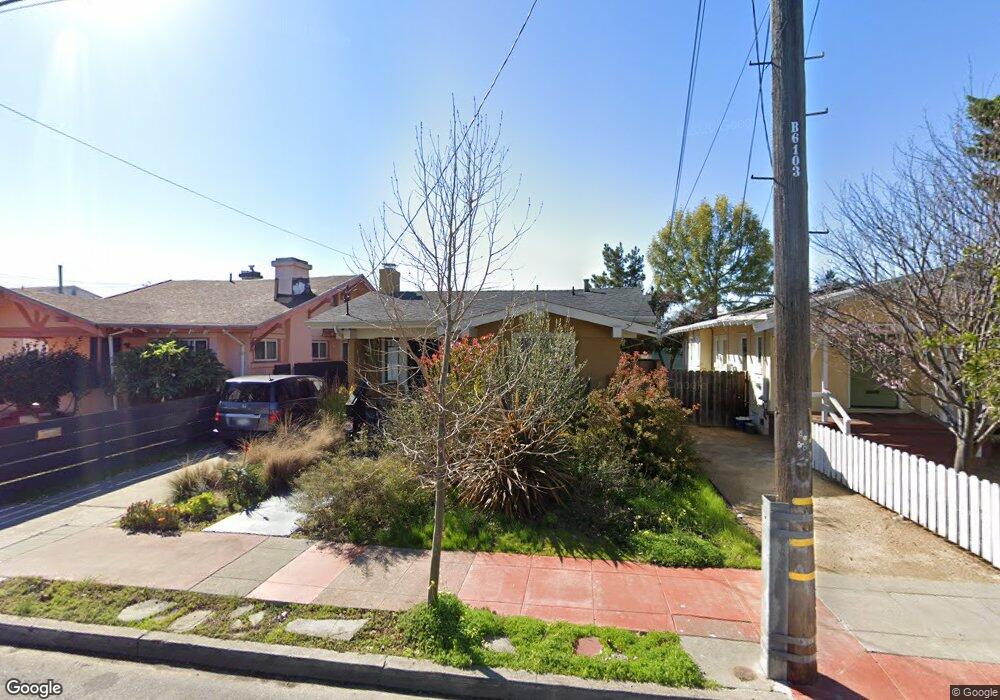
3014 Stanton St Berkeley, CA 94702
West Berkeley NeighborhoodEstimated Value: $1,188,342 - $1,415,000
3
Beds
2
Baths
1,316
Sq Ft
$996/Sq Ft
Est. Value
About This Home
This home is located at 3014 Stanton St, Berkeley, CA 94702 and is currently estimated at $1,310,336, approximately $995 per square foot. 3014 Stanton St is a home located in Alameda County with nearby schools including Malcolm X Elementary School, Washington Elementary School, and Oxford Elementary School.
Ownership History
Date
Name
Owned For
Owner Type
Purchase Details
Closed on
Mar 18, 2014
Sold by
Reo Homes 3 Llc
Bought by
Kavein K Lo & Mary Gnuey Fong Lo Family
Current Estimated Value
Purchase Details
Closed on
Oct 12, 2012
Sold by
Guiton Tomika and Guiton Richard V
Bought by
Reo Homes 3 Llc
Purchase Details
Closed on
Dec 8, 1998
Sold by
Guiton O V
Bought by
Oscar V Guiton Sr Living Trust
Purchase Details
Closed on
Oct 28, 1998
Sold by
Guiton O V
Bought by
Guiton Oscar V
Create a Home Valuation Report for This Property
The Home Valuation Report is an in-depth analysis detailing your home's value as well as a comparison with similar homes in the area
Home Values in the Area
Average Home Value in this Area
Purchase History
| Date | Buyer | Sale Price | Title Company |
|---|---|---|---|
| Kavein K Lo & Mary Gnuey Fong Lo Family | $750,000 | Chicago Title Company | |
| Reo Homes 3 Llc | $270,000 | Chicago Title Company | |
| Oscar V Guiton Sr Living Trust | -- | -- | |
| Guiton Oscar V | -- | -- |
Source: Public Records
Tax History
| Year | Tax Paid | Tax Assessment Tax Assessment Total Assessment is a certain percentage of the fair market value that is determined by local assessors to be the total taxable value of land and additions on the property. | Land | Improvement |
|---|---|---|---|---|
| 2025 | $13,866 | $919,357 | $275,807 | $643,550 |
| 2024 | $13,866 | $901,334 | $270,400 | $630,934 |
| 2023 | $13,525 | $883,664 | $265,099 | $618,565 |
| 2022 | $13,237 | $866,340 | $259,902 | $606,438 |
| 2021 | $13,280 | $849,360 | $254,808 | $594,552 |
| 2020 | $12,634 | $840,651 | $252,195 | $588,456 |
| 2019 | $12,204 | $824,174 | $247,252 | $576,922 |
| 2018 | $12,005 | $808,020 | $242,406 | $565,614 |
| 2017 | $11,586 | $792,180 | $237,654 | $554,526 |
| 2016 | $11,252 | $776,647 | $232,994 | $543,653 |
| 2015 | $11,104 | $764,984 | $229,495 | $535,489 |
| 2014 | $5,146 | $271,224 | $135,612 | $135,612 |
Source: Public Records
Map
Nearby Homes
- 2922 Stanton St
- 1507 Prince St
- 1314 Ashby Ave
- 3101 Sacramento St
- 1535 Julia St
- 3032 Mabel St
- 3110 California St
- 3114 California St
- 3138 California St
- 1237 Ashby Ave
- 2790 Sacramento St
- 1530 Stuart St
- 2782 Sacramento St
- 2774 Sacramento St
- 1646 Ashby Ave
- 2758 Sacramento St
- 1450 Ward St
- 1080 67th St
- 2750 Sacramento St
- 3224 Sacramento St
Your Personal Tour Guide
Ask me questions while you tour the home.