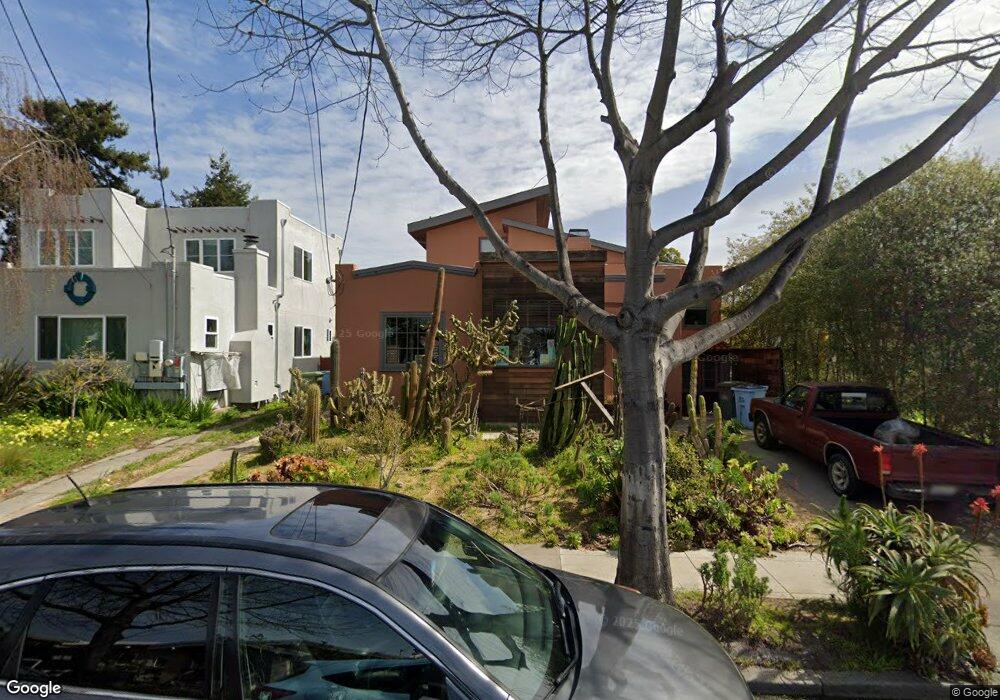
3015 Dohr St Berkeley, CA 94702
West Berkeley NeighborhoodEstimated Value: $1,250,000 - $1,716,826
2
Beds
2
Baths
1,881
Sq Ft
$763/Sq Ft
Est. Value
About This Home
This home is located at 3015 Dohr St, Berkeley, CA 94702 and is currently estimated at $1,435,957, approximately $763 per square foot. 3015 Dohr St is a home located in Alameda County with nearby schools including Malcolm X Elementary School, Washington Elementary School, and Oxford Elementary School.
Ownership History
Date
Name
Owned For
Owner Type
Purchase Details
Closed on
Jul 9, 2018
Sold by
Kinsey Donna M and Estate Of Gerald James Greene
Bought by
Friend Nicholas and Ives Rebecca
Current Estimated Value
Home Financials for this Owner
Home Financials are based on the most recent Mortgage that was taken out on this home.
Original Mortgage
$724,000
Outstanding Balance
$627,454
Interest Rate
4.5%
Mortgage Type
New Conventional
Estimated Equity
$808,503
Purchase Details
Closed on
Mar 12, 2012
Sold by
Hooker Jean S
Bought by
Greene Gerald James
Create a Home Valuation Report for This Property
The Home Valuation Report is an in-depth analysis detailing your home's value as well as a comparison with similar homes in the area
Home Values in the Area
Average Home Value in this Area
Purchase History
| Date | Buyer | Sale Price | Title Company |
|---|---|---|---|
| Friend Nicholas | $905,000 | Old Republic Title Company | |
| Greene Gerald James | -- | None Available |
Source: Public Records
Mortgage History
| Date | Status | Borrower | Loan Amount |
|---|---|---|---|
| Open | Friend Nicholas | $724,000 |
Source: Public Records
Tax History
| Year | Tax Paid | Tax Assessment Tax Assessment Total Assessment is a certain percentage of the fair market value that is determined by local assessors to be the total taxable value of land and additions on the property. | Land | Improvement |
|---|---|---|---|---|
| 2025 | $17,534 | $1,097,492 | $557,750 | $546,742 |
| 2024 | $17,534 | $1,075,838 | $546,815 | $536,023 |
| 2023 | $17,107 | $1,061,610 | $536,095 | $525,515 |
| 2022 | $16,728 | $1,033,797 | $525,585 | $515,212 |
| 2021 | $15,724 | $915,351 | $515,280 | $407,071 |
| 2020 | $14,176 | $912,900 | $510,000 | $402,900 |
| 2019 | $13,625 | $895,000 | $500,000 | $395,000 |
| 2018 | $13,130 | $850,000 | $400,000 | $450,000 |
| 2017 | $1,574 | $230,067 | $69,020 | $161,047 |
| 2016 | $1,516 | $225,557 | $67,667 | $157,890 |
| 2015 | $1,472 | $222,170 | $66,651 | $155,519 |
| 2014 | $1,412 | $217,818 | $65,345 | $152,473 |
Source: Public Records
Map
Nearby Homes
- 1507 Prince St
- 2922 Stanton St
- 3000 Acton St
- 3101 Sacramento St
- 1538 Ashby Ave
- 1314 Ashby Ave
- 3114 California St
- 3138 California St
- 3032 Mabel St
- 2829 California St
- 3224 Sacramento St
- 1237 Ashby Ave
- 1080 67th St
- 2790 Sacramento St
- 2782 Sacramento St
- 2774 Sacramento St
- 2758 Sacramento St
- 1450 Ward St
- 2750 Sacramento St
- 1046 Alcatraz Ave
Your Personal Tour Guide
Ask me questions while you tour the home.