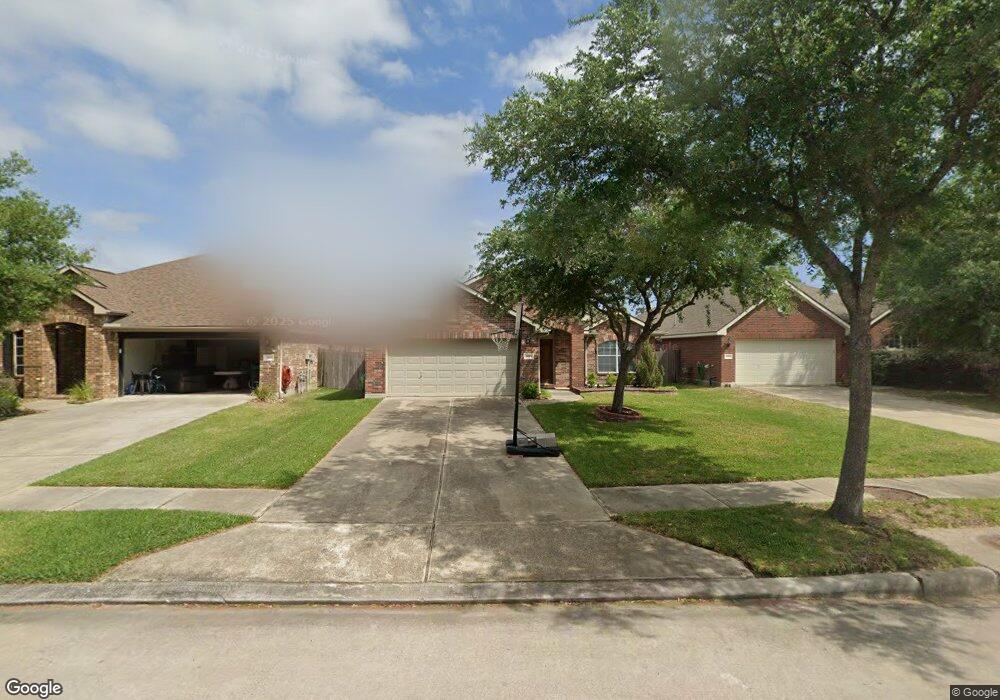
3015 Rusty Bridge Ct Spring, TX 77386
Imperial Oaks NeighborhoodEstimated Value: $324,100 - $337,000
3
Beds
2
Baths
2,270
Sq Ft
$145/Sq Ft
Est. Value
About This Home
This home is located at 3015 Rusty Bridge Ct, Spring, TX 77386 and is currently estimated at $328,275, approximately $144 per square foot. 3015 Rusty Bridge Ct is a home located in Montgomery County with nearby schools including Kaufman Elementary School, Vogel Intermediate School, and Irons J High School.
Ownership History
Date
Name
Owned For
Owner Type
Purchase Details
Closed on
Oct 29, 2015
Sold by
Gentry Catherine A and Gentry Jeffrey P
Bought by
Fox Steven R
Current Estimated Value
Home Financials for this Owner
Home Financials are based on the most recent Mortgage that was taken out on this home.
Original Mortgage
$195,605
Outstanding Balance
$154,632
Interest Rate
3.94%
Mortgage Type
New Conventional
Estimated Equity
$173,643
Purchase Details
Closed on
Dec 22, 2006
Sold by
Weekley Homes Lp
Bought by
Gentry Jeffrey P and Gentry Catherine A
Home Financials for this Owner
Home Financials are based on the most recent Mortgage that was taken out on this home.
Original Mortgage
$133,602
Interest Rate
6.27%
Mortgage Type
Purchase Money Mortgage
Purchase Details
Closed on
Sep 19, 2006
Sold by
Imperial Oaks No 3 Ltd
Bought by
Fox Steven R
Create a Home Valuation Report for This Property
The Home Valuation Report is an in-depth analysis detailing your home's value as well as a comparison with similar homes in the area
Home Values in the Area
Average Home Value in this Area
Purchase History
| Date | Buyer | Sale Price | Title Company |
|---|---|---|---|
| Fox Steven R | -- | Stewart Title Of Montgomery | |
| Gentry Jeffrey P | -- | Priority Title Co | |
| Fox Steven R | -- | -- |
Source: Public Records
Mortgage History
| Date | Status | Borrower | Loan Amount |
|---|---|---|---|
| Open | Fox Steven R | $195,605 | |
| Previous Owner | Gentry Jeffrey P | $133,602 |
Source: Public Records
Tax History
| Year | Tax Paid | Tax Assessment Tax Assessment Total Assessment is a certain percentage of the fair market value that is determined by local assessors to be the total taxable value of land and additions on the property. | Land | Improvement |
|---|---|---|---|---|
| 2025 | $6,190 | $344,349 | $50,000 | $294,349 |
| 2024 | $5,677 | $334,664 | -- | -- |
| 2023 | $5,677 | $304,240 | $50,000 | $285,040 |
| 2022 | $7,067 | $276,580 | $29,200 | $298,330 |
| 2021 | $6,947 | $251,440 | $29,200 | $222,240 |
| 2020 | $7,149 | $247,880 | $29,200 | $218,680 |
| 2019 | $6,922 | $233,490 | $29,200 | $204,290 |
| 2018 | $5,794 | $218,700 | $29,200 | $189,500 |
| 2017 | $6,521 | $218,700 | $29,200 | $189,500 |
| 2016 | $6,214 | $208,420 | $29,200 | $179,220 |
| 2015 | $5,536 | $205,930 | $29,200 | $176,730 |
| 2014 | $5,536 | $191,860 | $29,200 | $162,660 |
Source: Public Records
Map
Nearby Homes
- 2907 Bright Sky Ct
- 2954 Smokey Forest Ln
- 3320 Atwood Creek Ct
- 31826 Windwood Park Ln
- 3315 Rose Trace Dr
- 2618 Bridgestone Park Ln
- 31525 Ember Trail Ln
- 3211 Burton Ridge Dr
- 2710 Fountainbrook Park Ct
- 31410 Ashland Park Ln
- 30719 Aldine Westfield Rd
- 30715 Eastridge Dr
- 2511 Bridgestone Park Ln
- 3604 Magnolia Crest Ln
- 30615 Winlock Trails Dr
- 31243 Quail Oak Park Ln
- 31419 Fountainbrook Park Ln
- 3301 Asbury Glen Ct
- 30802 Lavender Trace Dr
- 31214 Windcrest Park Ln
- 3019 Rusty Bridge Ct
- 3011 Rusty Bridge Ct
- 3007 Rusty Bridge Ct
- 3023 Rusty Bridge Ct
- 3034 Ivory Forest Ln
- 3030 Ivory Forest Ln
- 3038 Ivory Forest Ln
- 3026 Ivory Forest Ln
- 3003 Rusty Bridge Ct
- 3027 Rusty Bridge Ct
- 3042 Ivory Forest Ln
- 3010 Rusty Bridge Ct
- 3022 Ivory Forest Ln
- 3014 Rusty Bridge Ct
- 3006 Rusty Bridge Ct
- 31047 Imperial Walk Ln
- 3026 Rusty Bridge Ct
- 3002 Rusty Bridge Ct
- 31039 Imperial Walk Ln
- 3018 Rusty Bridge Ct
Your Personal Tour Guide
Ask me questions while you tour the home.