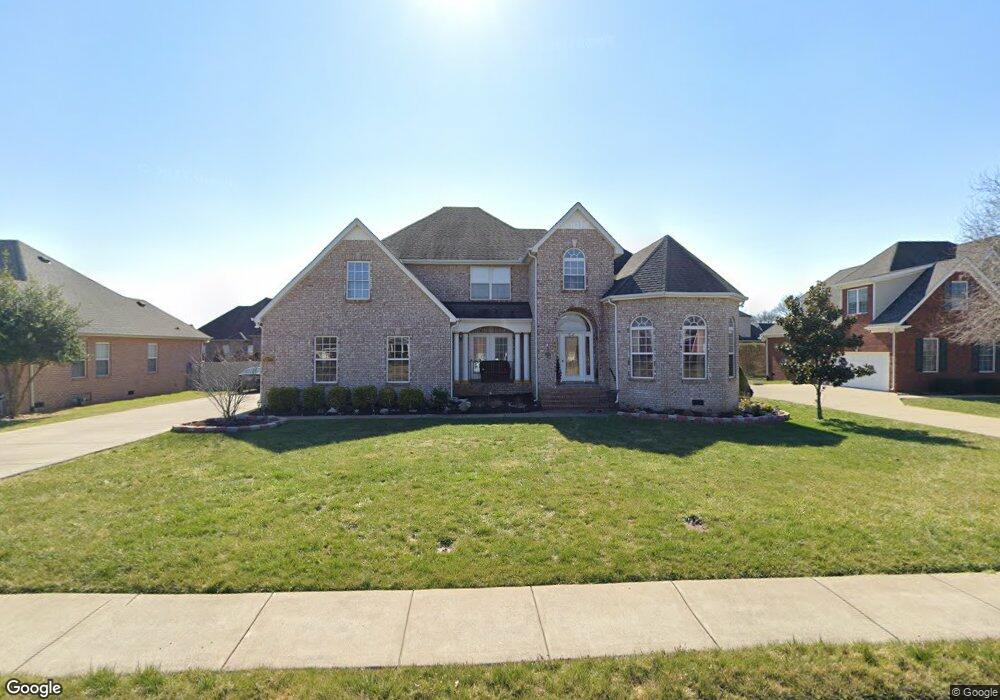
3015 Spottswood Cir Murfreesboro, TN 37128
Estimated Value: $500,257 - $554,000
--
Bed
4
Baths
2,602
Sq Ft
$202/Sq Ft
Est. Value
About This Home
This home is located at 3015 Spottswood Cir, Murfreesboro, TN 37128 and is currently estimated at $526,814, approximately $202 per square foot. 3015 Spottswood Cir is a home located in Rutherford County with nearby schools including Salem Elementary School, Barfield Elementary School, and Rockvale Middle School.
Ownership History
Date
Name
Owned For
Owner Type
Purchase Details
Closed on
Dec 26, 2018
Sold by
Vongsaljphanh Vanny V and Vongsaljphanh Phoutsakhone A
Bought by
Vongsamphanh Keith and Vongsamphanh Phoutsakhone A
Current Estimated Value
Home Financials for this Owner
Home Financials are based on the most recent Mortgage that was taken out on this home.
Original Mortgage
$281,084
Outstanding Balance
$248,123
Interest Rate
4.8%
Mortgage Type
FHA
Estimated Equity
$278,691
Purchase Details
Closed on
Nov 17, 2004
Sold by
C & M Enterprises Inc
Bought by
Vongsamphanh Vanny V and Vongsamphanh Phouts
Home Financials for this Owner
Home Financials are based on the most recent Mortgage that was taken out on this home.
Original Mortgage
$211,777
Interest Rate
5.6%
Purchase Details
Closed on
Jun 28, 2004
Sold by
Bmb Development
Bought by
C & M Enterprises Inc
Home Financials for this Owner
Home Financials are based on the most recent Mortgage that was taken out on this home.
Original Mortgage
$186,800
Interest Rate
6.25%
Create a Home Valuation Report for This Property
The Home Valuation Report is an in-depth analysis detailing your home's value as well as a comparison with similar homes in the area
Home Values in the Area
Average Home Value in this Area
Purchase History
| Date | Buyer | Sale Price | Title Company |
|---|---|---|---|
| Vongsamphanh Keith | -- | None Available | |
| Vongsamphanh Vanny V | $235,308 | -- | |
| C & M Enterprises Inc | $42,000 | -- |
Source: Public Records
Mortgage History
| Date | Status | Borrower | Loan Amount |
|---|---|---|---|
| Open | Vongsamphanh Keith | $281,084 | |
| Closed | C & M Enterprises Inc | $211,777 | |
| Previous Owner | C & M Enterprises Inc | $186,800 |
Source: Public Records
Tax History Compared to Growth
Tax History
| Year | Tax Paid | Tax Assessment Tax Assessment Total Assessment is a certain percentage of the fair market value that is determined by local assessors to be the total taxable value of land and additions on the property. | Land | Improvement |
|---|---|---|---|---|
| 2025 | $2,966 | $104,850 | $13,750 | $91,100 |
| 2024 | $2,966 | $104,850 | $13,750 | $91,100 |
| 2023 | $1,967 | $104,850 | $13,750 | $91,100 |
| 2022 | $1,695 | $104,850 | $13,750 | $91,100 |
| 2021 | $1,666 | $75,050 | $12,500 | $62,550 |
| 2020 | $1,666 | $75,050 | $12,500 | $62,550 |
| 2019 | $1,666 | $75,050 | $12,500 | $62,550 |
| 2018 | $2,289 | $75,050 | $0 | $0 |
| 2017 | $2,295 | $59,050 | $0 | $0 |
| 2016 | $2,296 | $59,050 | $0 | $0 |
| 2015 | $2,296 | $59,050 | $0 | $0 |
| 2014 | $1,468 | $59,050 | $0 | $0 |
| 2013 | -- | $58,950 | $0 | $0 |
Source: Public Records
Map
Nearby Homes
- 2732 Avington Ct
- 3002 Stow Crossing
- 3111 Monrovia Dr
- 2812 Ruland Place
- 2818 Silver Springs Ct
- 2819 Silver Springs Ct
- 3736 Jerry Anderson Dr
- 2910 Morning Mist Ct
- 3708 Jerry Anderson Dr
- 3633 Jerry Anderson
- 3121 Castleton Dr
- 3640 Shady Forest Dr
- 3625 Shady Forest Dr
- 3032 Morning Mist Ct
- 3613 Shady Forest Dr
- 3605 Shady Forest Dr
- 3633 Capstone Dr
- 3636 Pelham Wood Dr
- 3628 Pelham Wood Dr
- 3411 Geneva Dr
- 3011 Spottswood Cir
- 3019 Spottswood Cir
- 3016 Silver Springs Ct
- 3020 Silver Springs Ct
- 3012 Silver Springs Ct
- 3007 Spottswood Cir
- 3014 Spottswood Cir
- 3304 Sulphur Springs Rd
- 3023 Spottswood Cir
- 3010 Spottswood Cir
- 3018 Spottswood Cir
- 3008 Silver Springs Ct
- 3026 Spottswood Cir
- 3024 Silver Springs Ct
- 3006 Spottswood Cir
- 3003 Spottswood Cir
- 3022 Spottswood Cir
- 3025 Shady Glen Cir
- 3029 Silver Springs Ct
- 3017 Silver Springs Ct