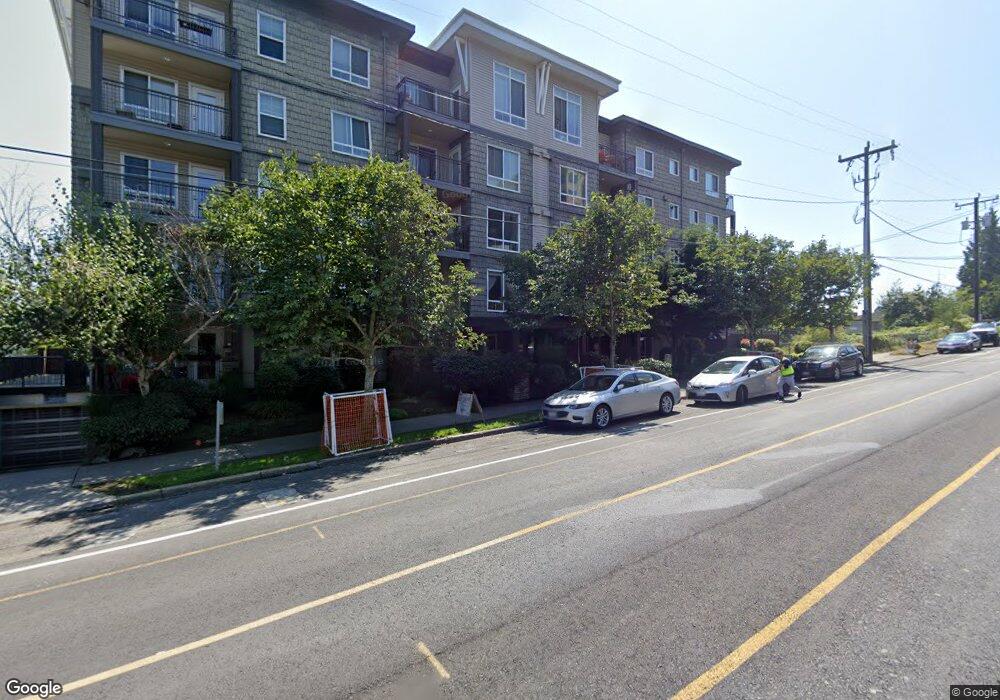
3015 SW Avalon Way Unit 102 Seattle, WA 98126
North Delridge NeighborhoodEstimated Value: $340,171 - $473,000
1
Bed
2
Baths
719
Sq Ft
$535/Sq Ft
Est. Value
About This Home
This home is located at 3015 SW Avalon Way Unit 102, Seattle, WA 98126 and is currently estimated at $384,543, approximately $534 per square foot. 3015 SW Avalon Way Unit 102 is a home located in King County with nearby schools including Lafayette Elementary School, Madison Middle School, and West Seattle High School.
Ownership History
Date
Name
Owned For
Owner Type
Purchase Details
Closed on
Mar 10, 2008
Sold by
Sewell Brandon D and Lee Sue
Bought by
Kraft David A
Current Estimated Value
Home Financials for this Owner
Home Financials are based on the most recent Mortgage that was taken out on this home.
Original Mortgage
$192,800
Outstanding Balance
$114,402
Interest Rate
4.87%
Mortgage Type
Purchase Money Mortgage
Estimated Equity
$270,141
Purchase Details
Closed on
Jul 20, 2005
Sold by
Simpson Joseph S
Bought by
Sewell Brandon D
Home Financials for this Owner
Home Financials are based on the most recent Mortgage that was taken out on this home.
Original Mortgage
$38,800
Interest Rate
5.51%
Mortgage Type
Credit Line Revolving
Purchase Details
Closed on
Feb 20, 2003
Sold by
3015 Sw Avalon Way Llc
Bought by
Simpson Joseph S
Home Financials for this Owner
Home Financials are based on the most recent Mortgage that was taken out on this home.
Original Mortgage
$123,960
Interest Rate
5.89%
Create a Home Valuation Report for This Property
The Home Valuation Report is an in-depth analysis detailing your home's value as well as a comparison with similar homes in the area
Home Values in the Area
Average Home Value in this Area
Purchase History
| Date | Buyer | Sale Price | Title Company |
|---|---|---|---|
| Kraft David A | $241,000 | Ticor National | |
| Kraft David A | -- | Ticor National | |
| Sewell Brandon D | $194,000 | Chicago Title | |
| Simpson Joseph S | $154,950 | Old Republic T |
Source: Public Records
Mortgage History
| Date | Status | Borrower | Loan Amount |
|---|---|---|---|
| Open | Kraft David A | $192,800 | |
| Previous Owner | Sewell Brandon D | $38,800 | |
| Previous Owner | Simpson Joseph S | $123,960 | |
| Closed | Simpson Joseph S | $30,900 |
Source: Public Records
Tax History Compared to Growth
Tax History
| Year | Tax Paid | Tax Assessment Tax Assessment Total Assessment is a certain percentage of the fair market value that is determined by local assessors to be the total taxable value of land and additions on the property. | Land | Improvement |
|---|---|---|---|---|
| 2024 | $2,876 | $305,000 | $61,300 | $243,700 |
| 2023 | $2,475 | $333,000 | $61,300 | $271,700 |
| 2022 | $2,789 | $297,000 | $61,300 | $235,700 |
| 2021 | $2,953 | $309,000 | $55,200 | $253,800 |
| 2020 | $3,026 | $311,000 | $53,600 | $257,400 |
| 2018 | $2,464 | $310,000 | $38,300 | $271,700 |
| 2017 | $1,882 | $253,000 | $30,600 | $222,400 |
| 2016 | $1,737 | $199,000 | $30,600 | $168,400 |
| 2015 | $1,651 | $179,000 | $27,600 | $151,400 |
| 2014 | -- | $174,000 | $24,500 | $149,500 |
| 2013 | -- | $148,000 | $24,500 | $123,500 |
Source: Public Records
Map
Nearby Homes
- 3046 SW Avalon Way
- 4040 32nd Ave SW
- 3112 SW Avalon Way Unit 102
- 3112 SW Avalon Way Unit 302
- 3210 SW Avalon Way
- 3221 SW Avalon Way Unit 413
- 3221 SW Avalon Way Unit 207
- 3022 SW Bradford St Unit 401
- 3022 SW Bradford St Unit 205
- 3846 35th Ave SW
- 4107 25th Ave SW
- 4111 25th Ave SW Unit LOT C
- 3823 Delridge Way SW
- 4531 26th Ave SW
- 3318 30th Ave SW Unit A502
- 3318 30th Ave SW Unit A501
- 0 Hjcf+vp4 Unit NWM2453830
- 3018 SW Hinds St
- 3843 22nd Ave SW
- 3854 22nd Ave SW
- 3015 SW Avalon Way
- 3015 SW Avalon Way Unit 308
- 3015 SW Avalon Way Unit 300
- 3015 SW Avalon Way Unit 506
- 3015 SW Avalon Way Unit 500
- 3015 SW Avalon Way Unit 302
- 3015 SW Avalon Way Unit 505
- 3015 SW Avalon Way Unit 504
- 3015 SW Avalon Way Unit 202
- 3015 SW Avalon Way Unit 104
- 3015 SW Avalon Way Unit 100
- 3015 SW Avalon Way Unit 107
- 3015 SW Avalon Way Unit 408
- 3015 SW Avalon Way Unit 204
- 3015 SW Avalon Way Unit 10
- 3015 SW Avalon Way Unit 201
- 3015 SW Avalon Way Unit 205
- 3015 SW Avalon Way Unit 206
- 3015 SW Avalon Way Unit 306
- 3015 SW Avalon Way Unit 403