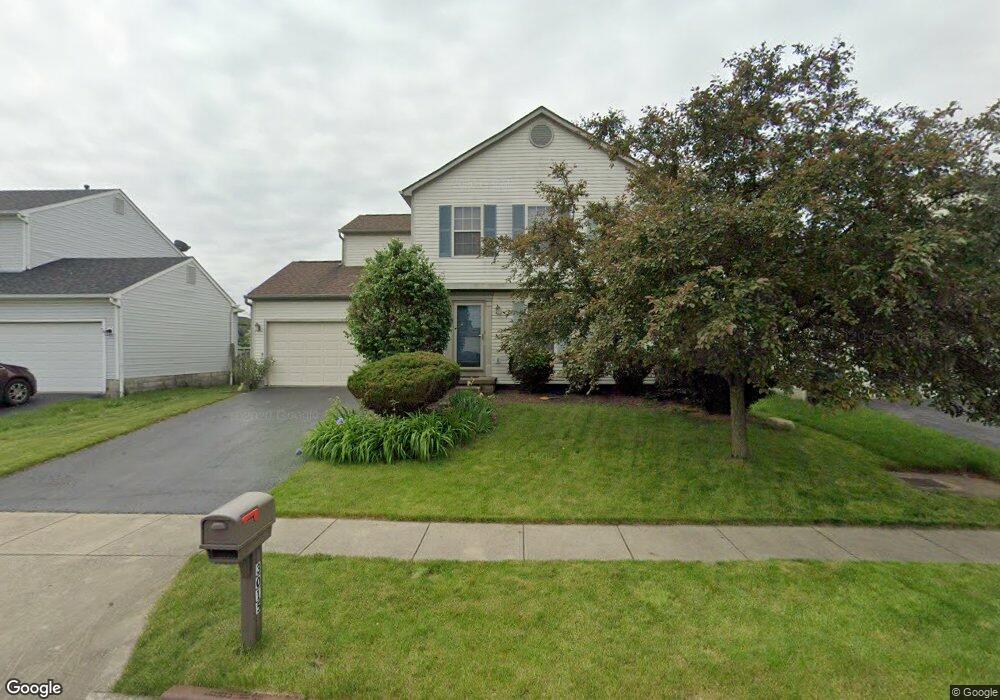
3015 Tracer Rd Columbus, OH 43232
Glenbrook NeighborhoodEstimated Value: $256,000 - $310,000
4
Beds
3
Baths
1,506
Sq Ft
$184/Sq Ft
Est. Value
About This Home
This home is located at 3015 Tracer Rd, Columbus, OH 43232 and is currently estimated at $277,178, approximately $184 per square foot. 3015 Tracer Rd is a home located in Franklin County with nearby schools including Groveport Madison High School, Millennium Community School, and Eastland Preparatory Academy.
Ownership History
Date
Name
Owned For
Owner Type
Purchase Details
Closed on
Dec 10, 2015
Sold by
Turner Derrick and Turner Stephanie
Bought by
Turner Stephanie E
Current Estimated Value
Home Financials for this Owner
Home Financials are based on the most recent Mortgage that was taken out on this home.
Original Mortgage
$88,400
Outstanding Balance
$35,823
Interest Rate
3.18%
Mortgage Type
New Conventional
Estimated Equity
$241,355
Purchase Details
Closed on
Aug 14, 2002
Sold by
Hud
Bought by
Turner Derrick and Turner Stephanie
Home Financials for this Owner
Home Financials are based on the most recent Mortgage that was taken out on this home.
Original Mortgage
$103,020
Interest Rate
6.41%
Mortgage Type
VA
Purchase Details
Closed on
Nov 7, 2001
Sold by
Martin Tyrone L
Bought by
Hud
Purchase Details
Closed on
Jun 12, 1997
Sold by
Booror Corp
Bought by
Martin Tyrone L
Home Financials for this Owner
Home Financials are based on the most recent Mortgage that was taken out on this home.
Original Mortgage
$118,596
Interest Rate
8.13%
Mortgage Type
FHA
Create a Home Valuation Report for This Property
The Home Valuation Report is an in-depth analysis detailing your home's value as well as a comparison with similar homes in the area
Home Values in the Area
Average Home Value in this Area
Purchase History
| Date | Buyer | Sale Price | Title Company |
|---|---|---|---|
| Turner Stephanie E | -- | Attorney | |
| Turner Derrick | $101,000 | Contract Processing & Title | |
| Hud | $95,000 | -- | |
| Martin Tyrone L | $122,100 | Alliance Title |
Source: Public Records
Mortgage History
| Date | Status | Borrower | Loan Amount |
|---|---|---|---|
| Open | Turner Stephanie E | $88,400 | |
| Closed | Turner Derrick | $103,020 | |
| Previous Owner | Martin Tyrone L | $118,596 |
Source: Public Records
Tax History Compared to Growth
Tax History
| Year | Tax Paid | Tax Assessment Tax Assessment Total Assessment is a certain percentage of the fair market value that is determined by local assessors to be the total taxable value of land and additions on the property. | Land | Improvement |
|---|---|---|---|---|
| 2024 | $3,333 | $78,610 | $21,000 | $57,610 |
| 2023 | $3,302 | $78,610 | $21,000 | $57,610 |
| 2022 | $2,257 | $44,700 | $6,340 | $38,360 |
| 2021 | $2,264 | $44,700 | $6,340 | $38,360 |
| 2020 | $2,268 | $44,700 | $6,340 | $38,360 |
| 2019 | $2,077 | $36,620 | $5,080 | $31,540 |
| 2018 | $2,210 | $36,620 | $5,080 | $31,540 |
| 2017 | $2,096 | $36,620 | $5,080 | $31,540 |
| 2016 | $2,305 | $36,790 | $7,600 | $29,190 |
| 2015 | $2,330 | $36,790 | $7,600 | $29,190 |
| 2014 | $2,356 | $36,790 | $7,600 | $29,190 |
| 2013 | $1,037 | $38,710 | $7,980 | $30,730 |
Source: Public Records
Map
Nearby Homes
- 3059 Remington Ridge Rd
- 3100 Westaire Ct
- 3811 Bay Village St
- 2825 S Hampton Rd
- 3105 Wessex Ct
- 0 Wessex Ct
- 3365 Bruceton Ave
- 3830 Charbonnett Ct Unit 6-A
- 2425 Mason Village Ct Unit 2425
- 2472 Nassau Dr Unit 37D
- 2509 Burgandy Ln Unit 46B
- 2503 Burgandy Ln Unit 46A
- 2275 Cardston Ct
- 2252 Meridian Ct
- 4479 Gerling Blvd
- 4485 Helen Dr
- 4486 Helen Dr
- 0 Ravenswood Ct
- 4521 Helen Dr
- 3036 Wadsworth Ct
- 3009 Tracer Rd
- 3003 Tracer Rd
- 3033 Stonebluff Dr
- 3005 Stonebluff Dr
- 2996 Tracer Rd
- 3039 Stonebluff Dr
- 2997 Tracer Rd
- 3024 Stonebluff Dr
- 3018 Stonebluff Dr
- 2999 Stonebluff Dr
- 3012 Stonebluff Dr
- 3030 Stonebluff Dr
- 2991 Tracer Rd
- 3045 Stonebluff Dr
- 2974 Tracer Rd
- 3006 Stonebluff Dr
- 3036 Stonebluff Dr
- 2985 Tracer Rd
- 2993 Stonebluff Dr
- 3042 Stonebluff Dr