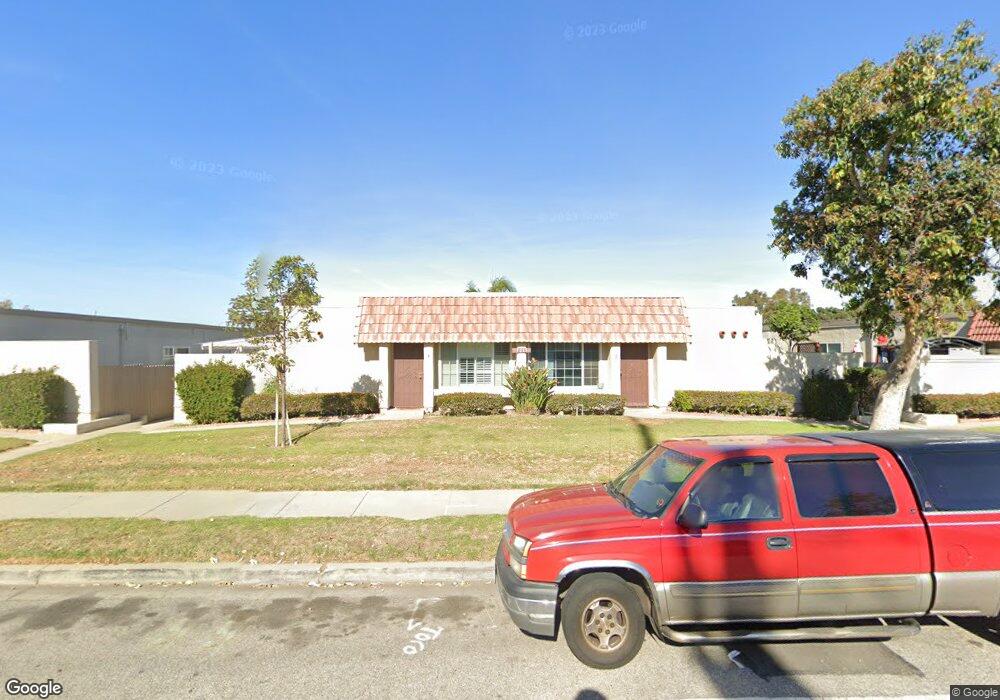
3015 W Hemlock St Unit 11 Oxnard, CA 93035
Via Marina NeighborhoodEstimated Value: $449,571 - $483,000
About This Home
This home is located at 3015 W Hemlock St Unit 11, Oxnard, CA 93035 and is currently estimated at $467,893, approximately $495 per square foot. 3015 W Hemlock St Unit 11 is a home located in Ventura County with nearby schools including Christa Mcauliffe Elementary School and Oxnard High School.
Ownership History
We collect this data history from publicly available records. To have your information removed, we recommend requesting removal directly through your county’s website.
Purchase Details
Purchase Details
Home Financials for this Owner
Home Financials are based on the most recent Mortgage that was taken out on this home.Purchase Details
Home Financials for this Owner
Home Financials are based on the most recent Mortgage that was taken out on this home.Home Values in the Area
Average Home Value in this Area
Purchase History
We collect this data history from publicly available records. To have your information removed, we recommend requesting removal directly through your county’s website.
| Date | Buyer | Sale Price | Title Company |
|---|---|---|---|
| -- | None Available | ||
| $179,000 | Chicago Title | ||
| $88,000 | First American Title Ins Co |
Mortgage History
We collect this data history from publicly available records. To have your information removed, we recommend requesting removal directly through your county’s website.
| Date | Status | Borrower | Loan Amount |
|---|---|---|---|
| Open | $143,200 | ||
| Previous Owner | $90,537 |
Tax History
We collect this data history from publicly available records. To have your information removed, we recommend requesting removal directly through your county’s website.
| Year | Tax Paid | Tax Assessment Tax Assessment Total Assessment is a certain percentage of the fair market value that is determined by local assessors to be the total taxable value of land and additions on the property. | Land | Improvement |
|---|---|---|---|---|
| 2025 | $3,165 | $259,227 | $103,688 | $155,539 |
| 2024 | $3,165 | $254,145 | $101,655 | $152,490 |
| 2023 | $3,050 | $249,162 | $99,662 | $149,500 |
| 2022 | $2,959 | $244,277 | $97,708 | $146,569 |
| 2021 | $2,935 | $239,488 | $95,792 | $143,696 |
| 2020 | $2,990 | $237,034 | $94,810 | $142,224 |
| 2019 | $2,906 | $232,387 | $92,951 | $139,436 |
| 2018 | $2,865 | $227,831 | $91,129 | $136,702 |
| 2017 | $2,720 | $223,365 | $89,343 | $134,022 |
| 2016 | $2,626 | $218,987 | $87,592 | $131,395 |
| 2015 | $2,653 | $215,699 | $86,277 | $129,422 |
| 2014 | $1,776 | $142,000 | $57,000 | $85,000 |
Map
- 469 Corvette St
- 2635 Hurricane Cove
- 2669 Foghorn Cove
- 437 Reed Way
- 2741 Bolker Dr Unit D
- 2749 Bolker Dr
- 2579 Northstar Cove
- 2522 Edgerton Place
- 221 Sharon Ln
- 1720 Elsinore Cir
- 650 W Hemlock St
- 160 W Fiesta Green
- 2538 Bolker Dr
- 2637 Sextant Ave Unit 4
- 3530 Isle Way
- 151 W Bay Blvd
- 2470 Bolker Dr
- 75 W Fiesta Green
- 2620 Tiller Ave
- 2610 Tiller Ave
- 445 Corvette St Unit Yankee retreat
- 445 Corvette St
- 443 Corvette St
- 453 Corvette St
- 455 Corvette St
- 441 Corvette St
- 451 Corvette St
- 439 Corvette St
- 437 Corvette St
- 457 Corvette St
- 459 Corvette St
- 0 Corvette Unit RN-3971
- 461 Corvette St
- 433 Corvette St
- 435 Corvette St
- 431 Corvette St
- 2638 Captains Ave
- 467 Corvette St
- 465 Corvette St
- 2640 Captains Ave
Ask me questions while you tour the home.