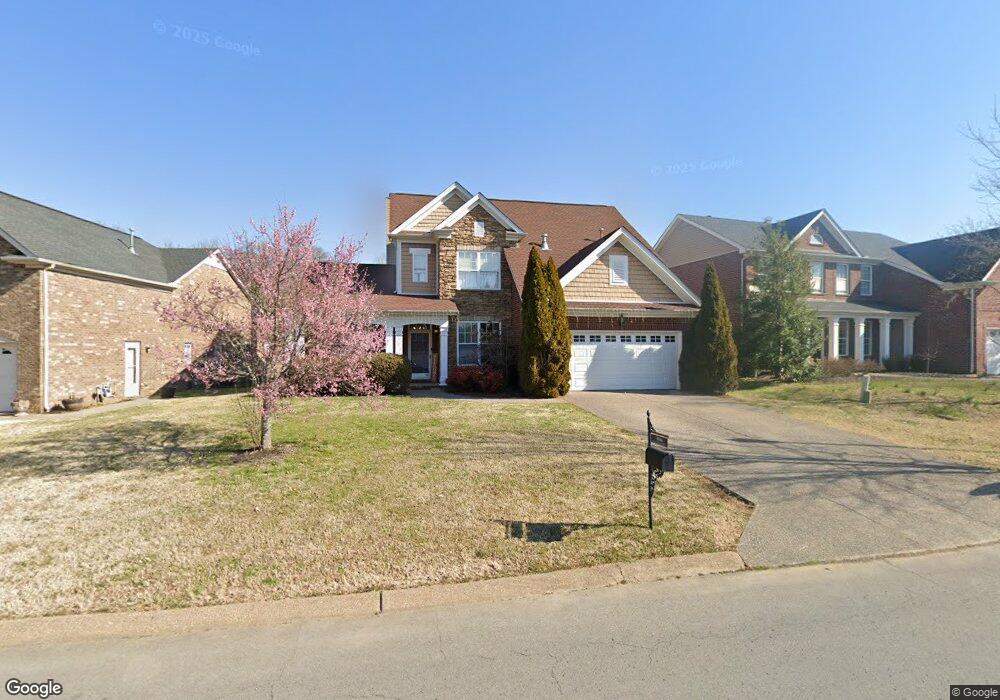
3016 Ballenger Dr Nolensville, TN 37135
Estimated Value: $627,000 - $688,000
--
Bed
3
Baths
2,485
Sq Ft
$265/Sq Ft
Est. Value
About This Home
This home is located at 3016 Ballenger Dr, Nolensville, TN 37135 and is currently estimated at $657,845, approximately $264 per square foot. 3016 Ballenger Dr is a home located in Williamson County with nearby schools including Nolensville Elementary School, Mill Creek Middle School, and Nolensville High School.
Ownership History
Date
Name
Owned For
Owner Type
Purchase Details
Closed on
Sep 30, 2021
Sold by
Mcmurtrey Russ H
Bought by
Mcmurtrey Erika and Thompson Erika G
Current Estimated Value
Home Financials for this Owner
Home Financials are based on the most recent Mortgage that was taken out on this home.
Original Mortgage
$430,000
Interest Rate
5.66%
Mortgage Type
New Conventional
Purchase Details
Closed on
Mar 17, 2016
Sold by
Spraggins Kimberly Paige and Mcdonald Lance
Bought by
Mcmurtrey Russ H and Thompson Ericka G
Home Financials for this Owner
Home Financials are based on the most recent Mortgage that was taken out on this home.
Original Mortgage
$264,000
Interest Rate
3.72%
Mortgage Type
New Conventional
Purchase Details
Closed on
Apr 14, 2005
Sold by
Beazer Homes Corp
Bought by
Spraggins Kimberly Paige and Mcdonald Lance
Home Financials for this Owner
Home Financials are based on the most recent Mortgage that was taken out on this home.
Original Mortgage
$177,000
Interest Rate
5.74%
Mortgage Type
Fannie Mae Freddie Mac
Create a Home Valuation Report for This Property
The Home Valuation Report is an in-depth analysis detailing your home's value as well as a comparison with similar homes in the area
Home Values in the Area
Average Home Value in this Area
Purchase History
| Date | Buyer | Sale Price | Title Company |
|---|---|---|---|
| Mcmurtrey Erika | -- | Madison Title | |
| Mcmurtrey Erika | -- | Madison Title | |
| Mcmurtrey Erika | -- | Madison Title | |
| Mcmurtrey Russ H | $330,000 | Bell & Alexander Title Svcs | |
| Spraggins Kimberly Paige | $221,340 | Homeland Title Inc |
Source: Public Records
Mortgage History
| Date | Status | Borrower | Loan Amount |
|---|---|---|---|
| Previous Owner | Mcmurtrey Erika | $430,000 | |
| Previous Owner | Mcmurtrey Russ H | $264,000 | |
| Previous Owner | Spraggins Kimberly Paige | $177,000 | |
| Closed | Spraggins Kimberly Paige | $33,195 |
Source: Public Records
Tax History Compared to Growth
Tax History
| Year | Tax Paid | Tax Assessment Tax Assessment Total Assessment is a certain percentage of the fair market value that is determined by local assessors to be the total taxable value of land and additions on the property. | Land | Improvement |
|---|---|---|---|---|
| 2025 | $2,064 | $154,250 | $41,250 | $113,000 |
| 2024 | $2,064 | $95,125 | $20,000 | $75,125 |
| 2023 | $2,064 | $95,125 | $20,000 | $75,125 |
| 2022 | $2,064 | $95,125 | $20,000 | $75,125 |
| 2021 | $2,064 | $95,125 | $20,000 | $75,125 |
| 2020 | $1,825 | $72,700 | $15,000 | $57,700 |
| 2019 | $1,723 | $72,700 | $15,000 | $57,700 |
| 2018 | $1,672 | $72,700 | $15,000 | $57,700 |
| 2017 | $1,658 | $72,700 | $15,000 | $57,700 |
| 2016 | $0 | $72,700 | $15,000 | $57,700 |
| 2015 | -- | $56,100 | $12,500 | $43,600 |
| 2014 | -- | $56,100 | $12,500 | $43,600 |
Source: Public Records
Map
Nearby Homes
- 3025 Ash Dale Ln
- 3051 Ash Dale Ln
- 3019 Ash Dale Ln
- 3027 Ash Dale Ln
- 904 Inglenook Ct
- 1228 Countryside Rd
- 1117 Millshed Dr
- 607 Quarter Horse Ln
- 813 Stonebrook Blvd
- 829 Stonebrook Blvd
- 1016 Dortch Ln
- 825 Piccadilly Dr
- 0 Nolensville Rd Unit RTC2807764
- 0 Nolensville Rd Unit RTC2818506
- 0 Bostic Unit RTC2516475
- 0 Nolensville Rd Unit RTC3017763
- 0 Rocky Fork Rd
- 3231 Bradfield Dr
- 1005 Kirkpark Ct
- 3236 Bradfield Dr
- 3012 Ballenger Dr
- 3020 Ballenger Dr
- 3008 Ballenger Dr
- 3028 Ballenger Dr
- 3017 Ballenger Dr
- 3021 Ballenger Dr
- 3013 Ballenger Dr
- 3004 Ballenger Dr
- 3025 Ballenger Dr
- 3032 Ballenger Dr
- 3009 Ballenger Dr
- 3029 Ballenger Dr
- 3000 Ballenger Dr
- 3005 Ballenger Dr
- 3036 Ballenger Dr
- 512 Cedar Brook Ln
- 3033 Ballenger Dr
- 3001 Ballenger Dr
- 3040 Ballenger Dr
- 3037 Ballenger Dr