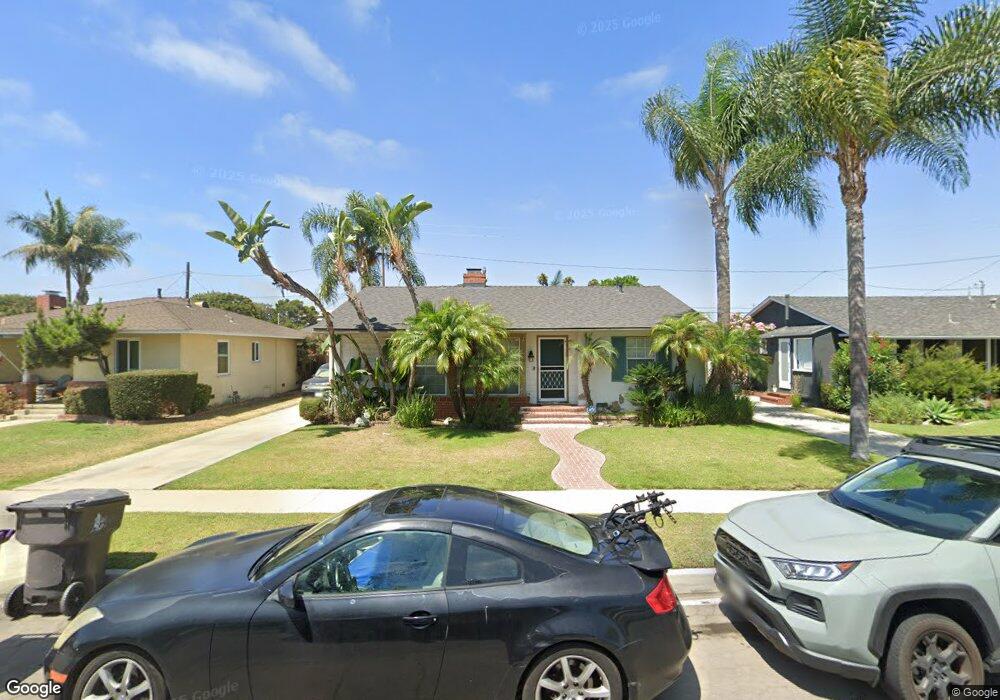
3017 Charlemagne Ave Long Beach, CA 90808
West Plaza NeighborhoodEstimated Value: $1,041,000 - $1,129,000
3
Beds
2
Baths
1,612
Sq Ft
$666/Sq Ft
Est. Value
About This Home
This home is located at 3017 Charlemagne Ave, Long Beach, CA 90808 and is currently estimated at $1,074,294, approximately $666 per square foot. 3017 Charlemagne Ave is a home located in Los Angeles County with nearby schools including Carver Elementary School, Marshall Academy of the Arts, and Millikan High School.
Ownership History
Date
Name
Owned For
Owner Type
Purchase Details
Closed on
Oct 13, 2020
Sold by
Fitzhugh Michael Anthony
Bought by
Fitzhugh Elizabeth Stevens
Current Estimated Value
Purchase Details
Closed on
Feb 25, 2003
Sold by
Erlick Katherine M
Bought by
Stevens Elizabeth M
Home Financials for this Owner
Home Financials are based on the most recent Mortgage that was taken out on this home.
Original Mortgage
$327,900
Outstanding Balance
$144,764
Interest Rate
6.25%
Estimated Equity
$929,530
Purchase Details
Closed on
Aug 29, 1995
Sold by
White James K and White David Homer
Bought by
Erlick Katherine M
Home Financials for this Owner
Home Financials are based on the most recent Mortgage that was taken out on this home.
Original Mortgage
$153,000
Interest Rate
7.88%
Create a Home Valuation Report for This Property
The Home Valuation Report is an in-depth analysis detailing your home's value as well as a comparison with similar homes in the area
Home Values in the Area
Average Home Value in this Area
Purchase History
| Date | Buyer | Sale Price | Title Company |
|---|---|---|---|
| Fitzhugh Elizabeth Stevens | -- | Lawyers Title Company | |
| Fitzhugh Elizabeth Stevens | -- | Lawyers Title Company | |
| Stevens Elizabeth M | $410,000 | North American Title Co | |
| Erlick Katherine M | $170,000 | Investors Title Company |
Source: Public Records
Mortgage History
| Date | Status | Borrower | Loan Amount |
|---|---|---|---|
| Open | Stevens Elizabeth M | $327,900 | |
| Previous Owner | Erlick Katherine M | $153,000 | |
| Closed | Stevens Elizabeth M | $80,000 | |
| Closed | Fitzhugh Elizabeth Stevens | $0 |
Source: Public Records
Tax History Compared to Growth
Tax History
| Year | Tax Paid | Tax Assessment Tax Assessment Total Assessment is a certain percentage of the fair market value that is determined by local assessors to be the total taxable value of land and additions on the property. | Land | Improvement |
|---|---|---|---|---|
| 2025 | $7,564 | $593,652 | $417,545 | $176,107 |
| 2024 | $7,564 | $582,012 | $409,358 | $172,654 |
| 2023 | $7,437 | $570,601 | $401,332 | $169,269 |
| 2022 | $6,978 | $559,413 | $393,463 | $165,950 |
| 2021 | $6,837 | $548,446 | $385,749 | $162,697 |
| 2019 | $6,735 | $532,180 | $374,308 | $157,872 |
| 2018 | $6,531 | $521,746 | $366,969 | $154,777 |
| 2016 | $6,000 | $501,488 | $352,720 | $148,768 |
| 2015 | $5,758 | $493,956 | $347,422 | $146,534 |
| 2014 | $5,715 | $484,281 | $340,617 | $143,664 |
Source: Public Records
Map
Nearby Homes
- 5302 E Mezzanine Way
- 5430 E Scrivener St
- 5341 E Lanai St
- 5161 E 27th St
- 5116 E Wardlow Rd
- 3361 N Bellflower Blvd
- 3140 San Anseline Ave
- 3430 Clark Ave
- 3253 Marwick Ave
- 5275 E 25th St
- 2680 Chatwin Ave
- 3503 Fidler Ave
- 2631 Radnor Ave
- 2376 Stanbridge Ave
- 2430 Marber Ave
- 3556 Rutgers Ave
- 2351 Argonne Ave
- 2381 N Bellflower Blvd
- 5856 E Scrivener St
- 2400 Quincy Ave
- 3023 Charlemagne Ave
- 3013 Charlemagne Ave
- 3029 Charlemagne Ave
- 3022 Heather Rd
- 3010 Heather Rd
- 3005 Charlemagne Ave
- 5235 E Spring St
- 3028 Heather Rd
- 3035 Charlemagne Ave
- 5229 E Spring St
- 3014 Charlemagne Ave
- 3020 Charlemagne Ave
- 3032 Heather Rd
- 3008 Charlemagne Ave
- 3024 Charlemagne Ave
- 3039 Charlemagne Ave
- 3030 Charlemagne Ave
- 5255 E Spring St
- 3038 Heather Rd
- 3017 Heather Rd