Estimated Value: $379,614 - $460,000
3
Beds
3
Baths
1,946
Sq Ft
$208/Sq Ft
Est. Value
About This Home
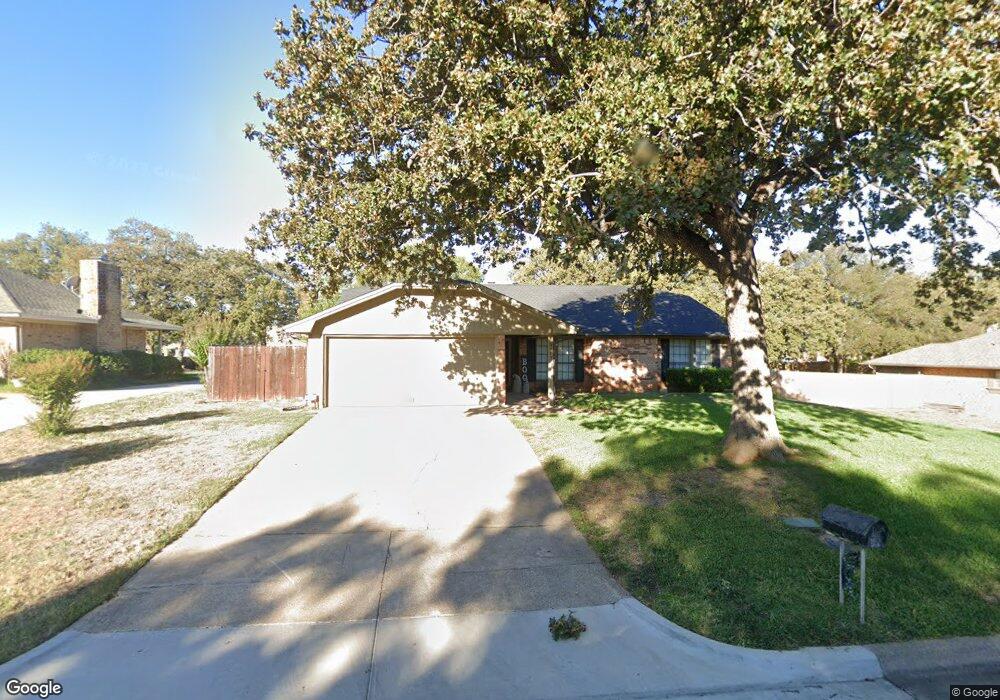
This home is located at 3017 Oak Ridge Dr, Hurst, TX 76054 and is currently estimated at $405,404, approximately $208 per square foot. 3017 Oak Ridge Dr is a home located in Tarrant County with nearby schools including W.A. Porter Elementary School, Smithfield Middle School, and Birdville High School.
Ownership History
Date
Name
Owned For
Owner Type
Purchase Details
Closed on
Feb 12, 2020
Sold by
Sommerhauser Daniel and Sommerhauser Julie
Bought by
Brown Matthew R and Brown Carl M
Current Estimated Value
Home Financials for this Owner
Home Financials are based on the most recent Mortgage that was taken out on this home.
Original Mortgage
$247,950
Outstanding Balance
$220,041
Interest Rate
3.72%
Mortgage Type
New Conventional
Estimated Equity
$185,363
Purchase Details
Closed on
Jan 21, 2012
Sold by
Baker Julie
Bought by
Sommerhauser Daniel
Purchase Details
Closed on
Jun 18, 1999
Sold by
Baker Alex B
Bought by
Baker Julie K
Purchase Details
Closed on
Jun 21, 1995
Sold by
Clarke David A and Clarke Linda Kay
Bought by
Baker Alex B and Baker Julie K
Home Financials for this Owner
Home Financials are based on the most recent Mortgage that was taken out on this home.
Original Mortgage
$88,650
Interest Rate
7.79%
Mortgage Type
FHA
Create a Home Valuation Report for This Property
The Home Valuation Report is an in-depth analysis detailing your home's value as well as a comparison with similar homes in the area
Home Values in the Area
Average Home Value in this Area
Purchase History
| Date | Buyer | Sale Price | Title Company |
|---|---|---|---|
| Brown Matthew R | -- | Texas Premier Title | |
| Sommerhauser Daniel | -- | None Available | |
| Baker Julie K | -- | -- | |
| Baker Alex B | -- | Trinity Western Title Co |
Source: Public Records
Mortgage History
| Date | Status | Borrower | Loan Amount |
|---|---|---|---|
| Open | Brown Matthew R | $247,950 | |
| Previous Owner | Baker Alex B | $88,650 |
Source: Public Records
Tax History Compared to Growth
Tax History
| Year | Tax Paid | Tax Assessment Tax Assessment Total Assessment is a certain percentage of the fair market value that is determined by local assessors to be the total taxable value of land and additions on the property. | Land | Improvement |
|---|---|---|---|---|
| 2025 | $6,242 | $365,000 | $60,000 | $305,000 |
| 2024 | $6,242 | $365,000 | $60,000 | $305,000 |
| 2023 | $7,439 | $368,698 | $60,000 | $308,698 |
| 2022 | $7,316 | $300,000 | $40,000 | $260,000 |
| 2021 | $6,978 | $269,000 | $40,000 | $229,000 |
| 2020 | $5,918 | $239,567 | $40,000 | $199,567 |
| 2019 | $5,503 | $242,951 | $40,000 | $202,951 |
| 2018 | $2,731 | $190,333 | $40,000 | $150,333 |
| 2017 | $4,617 | $216,743 | $40,000 | $176,743 |
| 2016 | $4,197 | $189,627 | $35,000 | $154,627 |
| 2015 | $2,771 | $143,000 | $20,000 | $123,000 |
| 2014 | $2,771 | $143,000 | $20,000 | $123,000 |
Source: Public Records
Map
Nearby Homes
- 6801 Woodland Hills Dr
- 6708 Nob Hill Ct
- 6704 Nob Hill Ct
- 2908 Steve Dr
- 2829 Sandstone Dr
- 7020 Live Oak Dr
- 713 Paul Dr
- 2809 Sandstone Dr
- 712 Springhill Dr
- 736 Springhill Dr
- 717 Reese Ln
- 2804 Ridgewood Dr
- 2844 Hurstview Dr
- 6625 Crane Rd
- 6521 Rock Springs Dr
- 3229 David Dr
- 3233 David Dr
- 3132 Hurstview Dr
- 712 Springwood Dr
- 3228 Oakdale Dr
- 3013 Oak Ridge Dr
- 3021 Oak Ridge Dr
- 3009 Oak Ridge Dr
- 737 Highland Crest Dr
- 3016 Oak Ridge Dr
- 3012 Oak Ridge Dr
- 6812 Switchback Trail
- 3008 Oak Ridge Dr
- 3001 Oak Ridge Dr
- 744 Highland Crest Dr
- 6816 Switchback Trail
- 6808 Switchback Trail
- 740 Highland Crest Dr
- 733 Highland Crest Dr
- 6804 Switchback Trail
- 736 Highland Crest Dr
- 6800 Switchback Trail
- 3000 Oak Ridge Dr
- 9237 Armadillo Trail
- 732 Highland Crest Dr