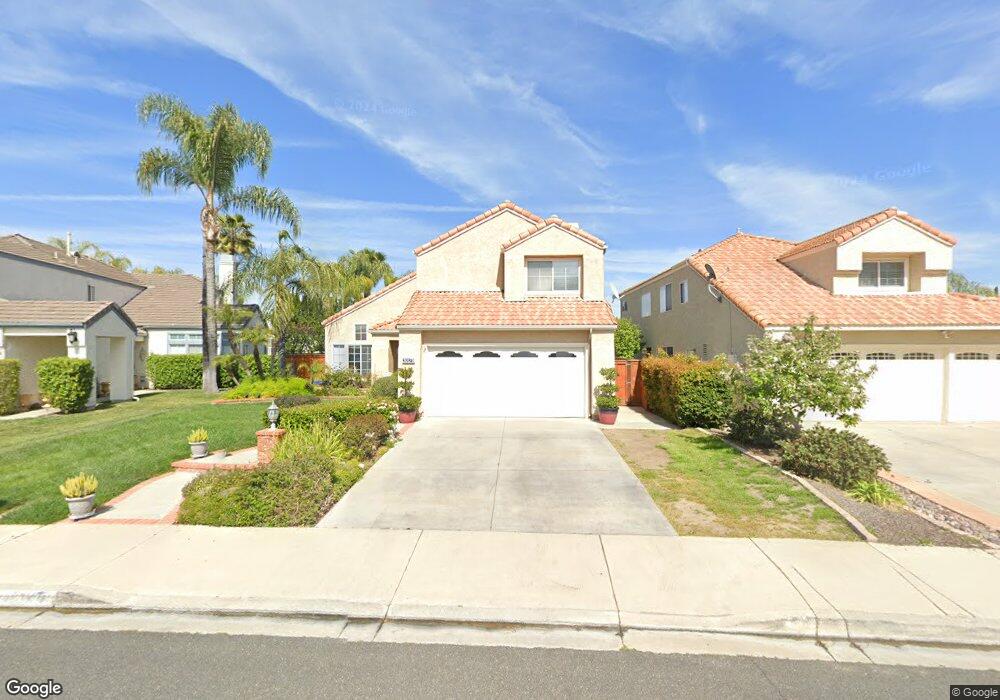
30178 Via Palermo Menifee, CA 92584
Menifee Lakes NeighborhoodEstimated Value: $530,648 - $563,000
3
Beds
3
Baths
1,643
Sq Ft
$333/Sq Ft
Est. Value
About This Home
This home is located at 30178 Via Palermo, Menifee, CA 92584 and is currently estimated at $546,412, approximately $332 per square foot. 30178 Via Palermo is a home located in Riverside County with nearby schools including Callie Kirkpatrick Elementary School, Bell Mountain Middle School, and Pinacate Middle School.
Ownership History
Date
Name
Owned For
Owner Type
Purchase Details
Closed on
Nov 10, 2021
Sold by
Flores Paul M
Bought by
Flores Sheri Lanette Wesselink
Current Estimated Value
Home Financials for this Owner
Home Financials are based on the most recent Mortgage that was taken out on this home.
Original Mortgage
$227,000
Outstanding Balance
$208,294
Interest Rate
3.09%
Mortgage Type
New Conventional
Estimated Equity
$338,118
Purchase Details
Closed on
Mar 16, 1999
Sold by
Swartz Stephen Paul and Swartz Renee Marie
Bought by
Wesselink Sheri L
Home Financials for this Owner
Home Financials are based on the most recent Mortgage that was taken out on this home.
Original Mortgage
$125,600
Interest Rate
6.96%
Create a Home Valuation Report for This Property
The Home Valuation Report is an in-depth analysis detailing your home's value as well as a comparison with similar homes in the area
Home Values in the Area
Average Home Value in this Area
Purchase History
| Date | Buyer | Sale Price | Title Company |
|---|---|---|---|
| Flores Sheri Lanette Wesselink | -- | Title365 | |
| Wesselink Sheri L | $157,000 | First American Title Co |
Source: Public Records
Mortgage History
| Date | Status | Borrower | Loan Amount |
|---|---|---|---|
| Open | Flores Sheri Lanette Wesselink | $227,000 | |
| Previous Owner | Wesselink Sheri L | $125,600 |
Source: Public Records
Tax History
| Year | Tax Paid | Tax Assessment Tax Assessment Total Assessment is a certain percentage of the fair market value that is determined by local assessors to be the total taxable value of land and additions on the property. | Land | Improvement |
|---|---|---|---|---|
| 2025 | $3,044 | $246,100 | $54,853 | $191,247 |
| 2023 | $3,044 | $236,546 | $52,724 | $183,822 |
| 2022 | $3,024 | $231,909 | $51,691 | $180,218 |
| 2021 | $2,974 | $227,363 | $50,678 | $176,685 |
| 2020 | $2,928 | $225,033 | $50,159 | $174,874 |
| 2019 | $2,859 | $220,622 | $49,176 | $171,446 |
| 2018 | $2,747 | $216,297 | $48,213 | $168,084 |
| 2017 | $2,703 | $212,057 | $47,268 | $164,789 |
| 2016 | $2,608 | $207,900 | $46,342 | $161,558 |
| 2015 | $2,572 | $204,779 | $45,647 | $159,132 |
| 2014 | $2,507 | $200,769 | $44,753 | $156,016 |
Source: Public Records
Map
Nearby Homes
- 30136 Via Amante
- 30138 Via Palermo
- 30105 Via Amante
- 30074 Via Palermo
- 30237 Calle Pompeii
- 28860 Champions Dr
- 29915 Camino Cristal
- 28955 Via Marsala
- 29855 Corte Cruzada
- 30146 Westlake Dr
- 30557 Bayport Ln
- 30211 Westlake Dr
- 30569 Meadow Run Place
- 30602 Willow Village Dr
- 30272 Tattersail Way
- 30209 Linden Gate Ln
- 30440 Teal Brook Dr
- 30632 Shoreline Dr
- 28091 Stillwater Dr
- 29835 Camino Cristal
- 30186 Via Palermo
- 30170 Via Palermo
- 30194 Via Palermo
- 30162 Via Palermo
- 30143 Via Amante
- 30131 Via Amante
- 30165 Via Amante
- 30127 Via Amante
- 30202 Via Palermo
- 30171 Via Palermo
- 30154 Via Palermo
- 30163 Via Palermo
- 30175 Via Amante
- 30189 Via Palermo
- 30123 Via Amante
- 30185 Via Amante
- 30153 Via Palermo
- 30210 Via Palermo
- 30146 Via Palermo
- 30119 Via Amante
Your Personal Tour Guide
Ask me questions while you tour the home.