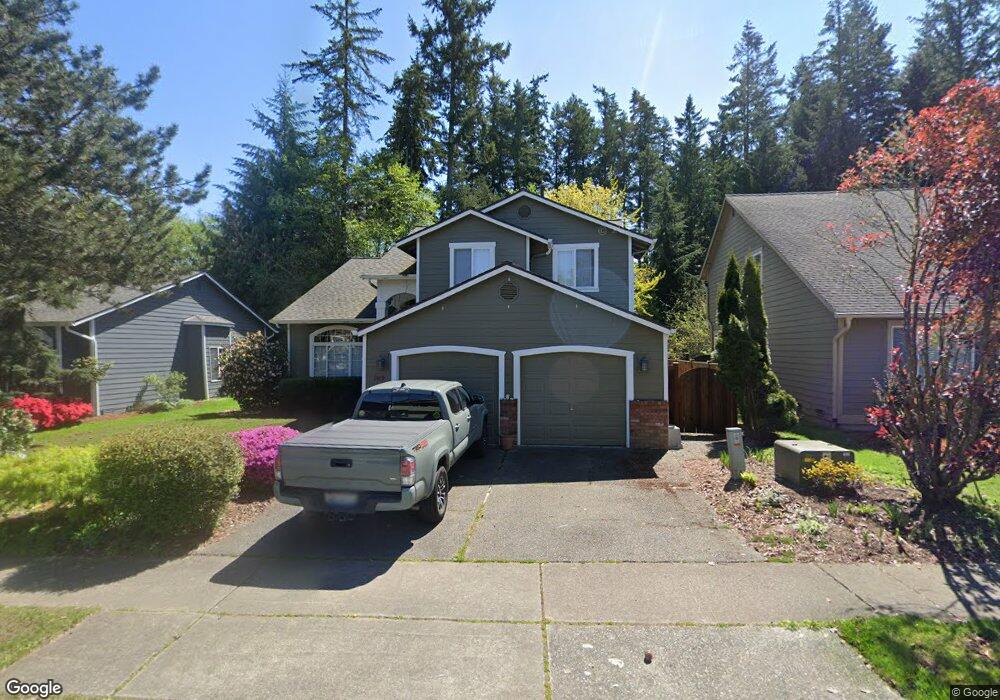
3018 200th Place SE Bothell, WA 98012
Thrasher's Corner-Red Hawk NeighborhoodEstimated Value: $1,061,000 - $1,164,180
5
Beds
3
Baths
2,200
Sq Ft
$509/Sq Ft
Est. Value
About This Home
This home is located at 3018 200th Place SE, Bothell, WA 98012 and is currently estimated at $1,119,545, approximately $508 per square foot. 3018 200th Place SE is a home located in Snohomish County with nearby schools including Canyon Creek Elementary School, Skyview Middle School, and North Creek High School.
Ownership History
Date
Name
Owned For
Owner Type
Purchase Details
Closed on
Apr 20, 2010
Sold by
Putnam Mark S and Putnam Carolyn L
Bought by
Austin Bob O and Austin Susan A
Current Estimated Value
Home Financials for this Owner
Home Financials are based on the most recent Mortgage that was taken out on this home.
Original Mortgage
$311,200
Outstanding Balance
$202,368
Interest Rate
4.92%
Mortgage Type
New Conventional
Estimated Equity
$917,177
Purchase Details
Closed on
Jun 17, 1996
Sold by
Wagner Richard E and Wagner Esther L
Bought by
Putnam Mark S and Putnam Carolyn L
Home Financials for this Owner
Home Financials are based on the most recent Mortgage that was taken out on this home.
Original Mortgage
$174,550
Interest Rate
8.25%
Create a Home Valuation Report for This Property
The Home Valuation Report is an in-depth analysis detailing your home's value as well as a comparison with similar homes in the area
Home Values in the Area
Average Home Value in this Area
Purchase History
| Date | Buyer | Sale Price | Title Company |
|---|---|---|---|
| Austin Bob O | $389,280 | Northpoint Escrow & Title Ll | |
| Putnam Mark S | $193,950 | Chicago Title Insurance Co |
Source: Public Records
Mortgage History
| Date | Status | Borrower | Loan Amount |
|---|---|---|---|
| Open | Austin Bob O | $311,200 | |
| Previous Owner | Putnam Mark S | $174,550 |
Source: Public Records
Tax History
| Year | Tax Paid | Tax Assessment Tax Assessment Total Assessment is a certain percentage of the fair market value that is determined by local assessors to be the total taxable value of land and additions on the property. | Land | Improvement |
|---|---|---|---|---|
| 2026 | $8,442 | $1,016,200 | $708,800 | $307,400 |
| 2025 | $7,855 | $1,002,700 | $703,200 | $299,500 |
| 2024 | $7,855 | $939,100 | $650,000 | $289,100 |
| 2023 | $8,271 | $1,077,600 | $743,600 | $334,000 |
| 2022 | $7,019 | $730,700 | $447,200 | $283,500 |
| 2020 | $6,331 | $612,900 | $369,000 | $243,900 |
| 2019 | $5,971 | $683,600 | $408,000 | $275,600 |
| 2018 | $5,540 | $518,500 | $275,000 | $243,500 |
| 2017 | $4,690 | $450,900 | $224,000 | $226,900 |
| 2016 | $4,563 | $425,100 | $205,000 | $220,100 |
| 2015 | $4,278 | $374,600 | $189,000 | $185,600 |
| 2013 | $4,179 | $318,500 | $158,000 | $160,500 |
Source: Public Records
Map
Nearby Homes
- 19911 34th Dr SE
- 3422 201st Place SE
- 20501 31st Dr SE
- 19520 Grannis Rd
- 20500 32nd Dr SE
- 3604 198th St SE
- 20524 32nd Dr SE
- 3618 202nd St SE
- 3126 194th St SE
- 3122 194th St SE
- 3822 194th St SE
- 3123 194th St SE
- 3121 194th St SE
- 3212 193rd Place SE
- 3323 207th Place SE
- 3125 194th St SE
- 19631 38th Dr SE
- 3912 199th Place SE
- 3908 199th SE
- 19832 39th Dr SE
- 3014 200th Place SE
- 3024 200th Place SE
- 815707 200th Place SE
- 3010 200th Place SE
- 3030 200th Place SE
- 3023 200th Place SE
- 3015 200th Place SE
- 3011 200th Place SE
- 3004 200th Place SE
- 3005 200th Place SE
- 3102 200th Place SE
- 3001 200th Place SE
- 20001 30th Dr SE
- 20009 30th Dr SE
- 3115 201st St SE
- 3106 200th Place SE
- 20002 30th Dr SE
- 3119 201st St SE
- 3103 200th Place SE
- 3003 200th St SE
Your Personal Tour Guide
Ask me questions while you tour the home.