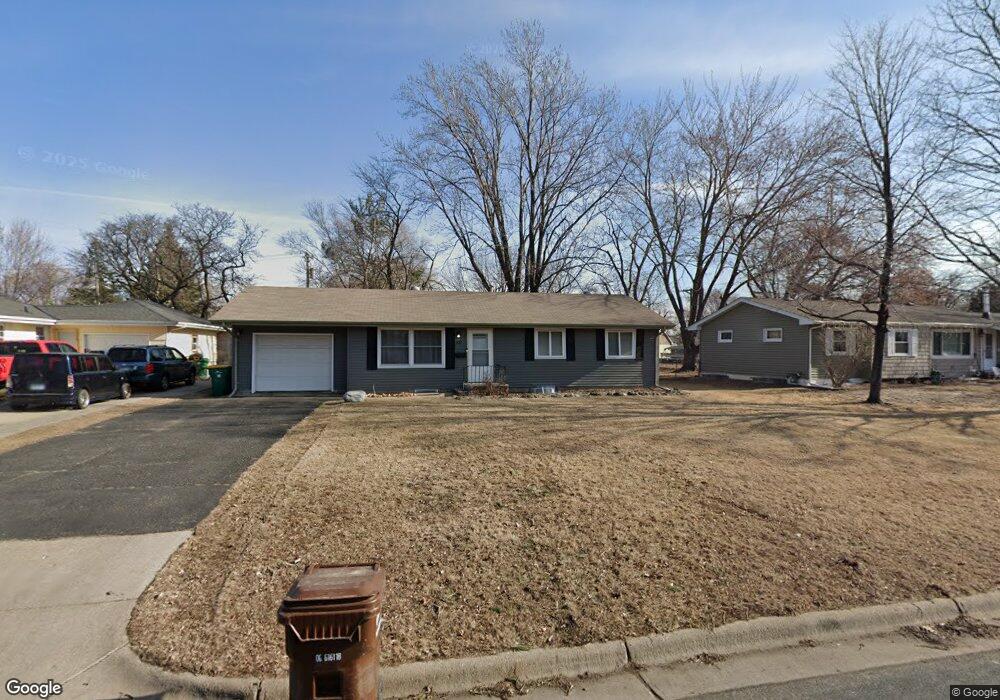
3018 65th Ave N Minneapolis, MN 55429
Garden City NeighborhoodEstimated Value: $295,324 - $328,000
3
Beds
2
Baths
1,569
Sq Ft
$197/Sq Ft
Est. Value
About This Home
This home is located at 3018 65th Ave N, Minneapolis, MN 55429 and is currently estimated at $308,831, approximately $196 per square foot. 3018 65th Ave N is a home located in Hennepin County with nearby schools including Garden City Elementary School, Park Center Senior High, and Progeny Academy.
Ownership History
Date
Name
Owned For
Owner Type
Purchase Details
Closed on
Mar 25, 2020
Sold by
Vang Jenny
Bought by
Linderholm Jennifer
Current Estimated Value
Home Financials for this Owner
Home Financials are based on the most recent Mortgage that was taken out on this home.
Original Mortgage
$205,832
Outstanding Balance
$181,946
Interest Rate
3.4%
Mortgage Type
New Conventional
Estimated Equity
$126,885
Purchase Details
Closed on
Apr 26, 2010
Sold by
Toquam Craig and Toquam Loy
Bought by
Vang Jenny
Purchase Details
Closed on
Jul 10, 2009
Sold by
Argueta Yesenia Tejada
Bought by
Wensmann Rich
Purchase Details
Closed on
Apr 7, 2006
Sold by
Davis Christine Boden and Davis Matthew L
Bought by
Tejada Vesenia
Purchase Details
Closed on
Nov 30, 2004
Sold by
Harrer Andrea J
Bought by
Davis Matthew L and Davis Christine B
Purchase Details
Closed on
Mar 30, 2001
Sold by
Olson Ida R
Bought by
Harrer Andrea J
Create a Home Valuation Report for This Property
The Home Valuation Report is an in-depth analysis detailing your home's value as well as a comparison with similar homes in the area
Home Values in the Area
Average Home Value in this Area
Purchase History
| Date | Buyer | Sale Price | Title Company |
|---|---|---|---|
| Linderholm Jennifer | $227,000 | Edina Realty Title Inc | |
| Vang Jenny | $135,000 | -- | |
| Wensmann Rich | $35,500 | -- | |
| Tejada Vesenia | $200,000 | -- | |
| Davis Matthew L | $186,000 | -- | |
| Harrer Andrea J | $125,000 | -- |
Source: Public Records
Mortgage History
| Date | Status | Borrower | Loan Amount |
|---|---|---|---|
| Open | Linderholm Jennifer | $205,832 |
Source: Public Records
Tax History Compared to Growth
Tax History
| Year | Tax Paid | Tax Assessment Tax Assessment Total Assessment is a certain percentage of the fair market value that is determined by local assessors to be the total taxable value of land and additions on the property. | Land | Improvement |
|---|---|---|---|---|
| 2024 | $3,761 | $262,200 | $83,000 | $179,200 |
| 2023 | $3,750 | $264,100 | $86,000 | $178,100 |
| 2022 | $3,006 | $253,000 | $79,000 | $174,000 |
| 2021 | $2,959 | $219,000 | $67,000 | $152,000 |
| 2020 | $3,060 | $203,000 | $57,000 | $146,000 |
| 2019 | $2,929 | $203,000 | $65,000 | $138,000 |
| 2018 | $2,528 | $185,000 | $54,000 | $131,000 |
| 2017 | $2,317 | $149,000 | $46,000 | $103,000 |
| 2016 | $2,014 | $131,900 | $44,500 | $87,400 |
| 2015 | $1,812 | $120,500 | $39,500 | $81,000 |
| 2014 | -- | $105,700 | $34,400 | $71,300 |
Source: Public Records
Map
Nearby Homes
- 2812 64th Ave N
- 2925 69th Ln N
- 6843 York Place N
- 6019 Zenith Ave N
- 5942 Zenith Ave N
- 3801 69th Ave N
- 5932 Admiral Ln N
- 4309 63rd Ave N
- 4418 65th Ave N
- 5808 Pearson Dr
- 3500 72nd Ave N
- 6413 Noble Ave N
- 6318 Perry Ave N
- 6342 Girard Ave N
- 3901 Burquest Ln
- 5819 Knox Ave N
- 1342 67th Ln N
- 5007 65th Ave N
- 6823 Fremont Place N
- 2108 73rd Ave N
- 3012 65th Ave N
- 3100 65th Ave N
- 3007 Quarles Rd
- 3013 Quarles Rd
- 3006 65th Ave N
- 3006 3006 N 65th Ave N
- 3106 65th Ave N
- 3025 65th Ave N
- 3019 Quarles Rd
- 3001 Quarles Rd
- 3101 65th Ave N
- 3019 65th Ave N
- 6501 Xerxes Ave N
- 3112 65th Ave N
- 3107 65th Ave N
- 3025 Quarles Rd
- 3013 65th Ave N
- 3113 3113 65th-Avenue-n
- 3007 65th Ave N
- 3007 3007 65th-Avenue-n