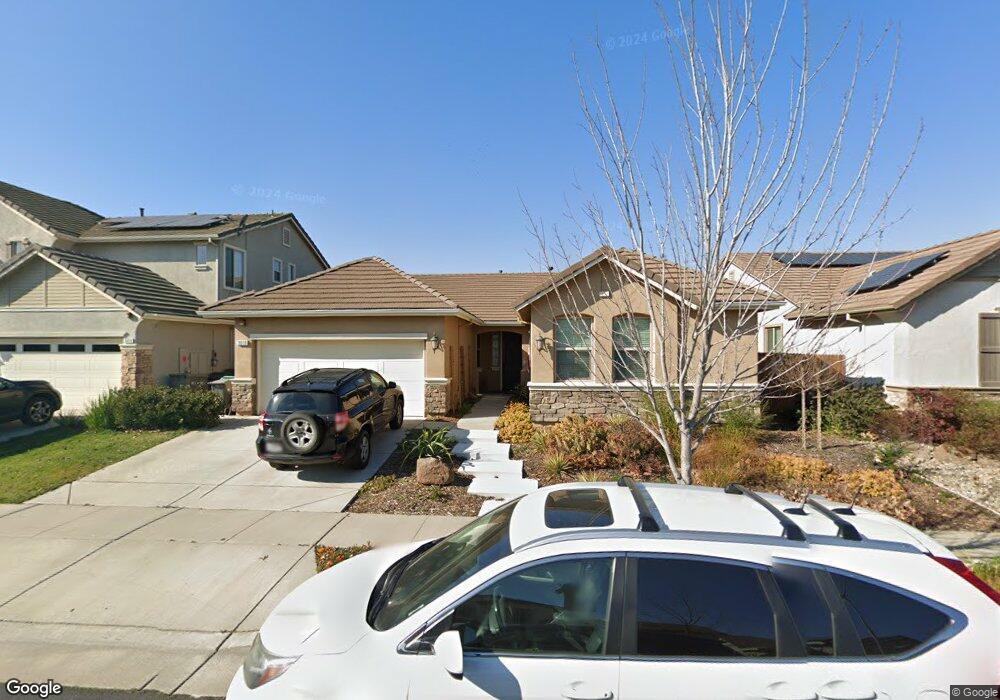
3018 Apache St West Sacramento, CA 95691
Southport NeighborhoodEstimated Value: $612,000 - $704,000
3
Beds
2
Baths
2,013
Sq Ft
$326/Sq Ft
Est. Value
About This Home
This home is located at 3018 Apache St, West Sacramento, CA 95691 and is currently estimated at $655,888, approximately $325 per square foot. 3018 Apache St is a home with nearby schools including Stonegate Elementary School, River City High, and Our Lady Of Grace.
Ownership History
Date
Name
Owned For
Owner Type
Purchase Details
Closed on
May 5, 2019
Sold by
Thibodo Brent and Thibodo Nicole
Bought by
Thibodo Brent C and Thobodo Nicole M
Current Estimated Value
Purchase Details
Closed on
Jan 22, 2015
Sold by
Thilbodo Nicole and Tellmann Nicole
Bought by
Thibodo Brent and Thibodo Nicole
Purchase Details
Closed on
Jun 25, 2013
Sold by
Premier United Communities Lp
Bought by
Tellmann Nicole
Home Financials for this Owner
Home Financials are based on the most recent Mortgage that was taken out on this home.
Original Mortgage
$327,600
Outstanding Balance
$232,932
Interest Rate
3.48%
Mortgage Type
New Conventional
Estimated Equity
$422,956
Purchase Details
Closed on
Nov 9, 2012
Sold by
United Communities Llc
Bought by
Premier United Communities Lp
Home Financials for this Owner
Home Financials are based on the most recent Mortgage that was taken out on this home.
Original Mortgage
$216,793
Interest Rate
3.34%
Mortgage Type
Seller Take Back
Create a Home Valuation Report for This Property
The Home Valuation Report is an in-depth analysis detailing your home's value as well as a comparison with similar homes in the area
Home Values in the Area
Average Home Value in this Area
Purchase History
| Date | Buyer | Sale Price | Title Company |
|---|---|---|---|
| Thibodo Brent C | -- | None Available | |
| Thibodo Brent | -- | None Available | |
| Tellmann Nicole | $364,500 | First American Title Company | |
| Premier United Communities Lp | -- | First American Title Ins Co |
Source: Public Records
Mortgage History
| Date | Status | Borrower | Loan Amount |
|---|---|---|---|
| Open | Tellmann Nicole | $327,600 | |
| Previous Owner | Premier United Communities Lp | $216,793 |
Source: Public Records
Tax History Compared to Growth
Tax History
| Year | Tax Paid | Tax Assessment Tax Assessment Total Assessment is a certain percentage of the fair market value that is determined by local assessors to be the total taxable value of land and additions on the property. | Land | Improvement |
|---|---|---|---|---|
| 2025 | $6,671 | $448,229 | $80,037 | $368,192 |
| 2023 | $6,671 | $430,826 | $76,930 | $353,896 |
| 2022 | $6,306 | $422,379 | $75,422 | $346,957 |
| 2021 | $6,267 | $414,098 | $73,944 | $340,154 |
| 2020 | $6,033 | $409,853 | $73,186 | $336,667 |
| 2019 | $5,985 | $401,817 | $71,751 | $330,066 |
| 2018 | $5,959 | $393,940 | $70,345 | $323,595 |
| 2017 | $5,869 | $386,216 | $68,966 | $317,250 |
| 2016 | $5,782 | $378,644 | $67,614 | $311,030 |
| 2015 | $5,526 | $372,958 | $66,599 | $306,359 |
| 2014 | $5,526 | $365,653 | $65,295 | $300,358 |
Source: Public Records
Map
Nearby Homes
- 1840 Sierra Rd
- 2975 Jefferson Blvd
- 3085 Parella Ct
- 3111 Lassen St
- 2764 Rogue River Cir
- 32508 Jefferson Blvd
- 209 Touchstone Place
- 324 Bridge Place
- 235 Touchstone Place
- 2726 Paradise Way
- 2556 Duet Dr
- 3175 Jefferson Blvd
- 0 Jefferson Blvd Unit 225119728
- 2586 Duet Dr
- 2625 Malibu Ct
- 2617 Independence Ave
- 2586 Lagoon Ln
- 2405 Coffeeberry Rd
- 2616 Independence Ave
- 3400 Partridge Ave