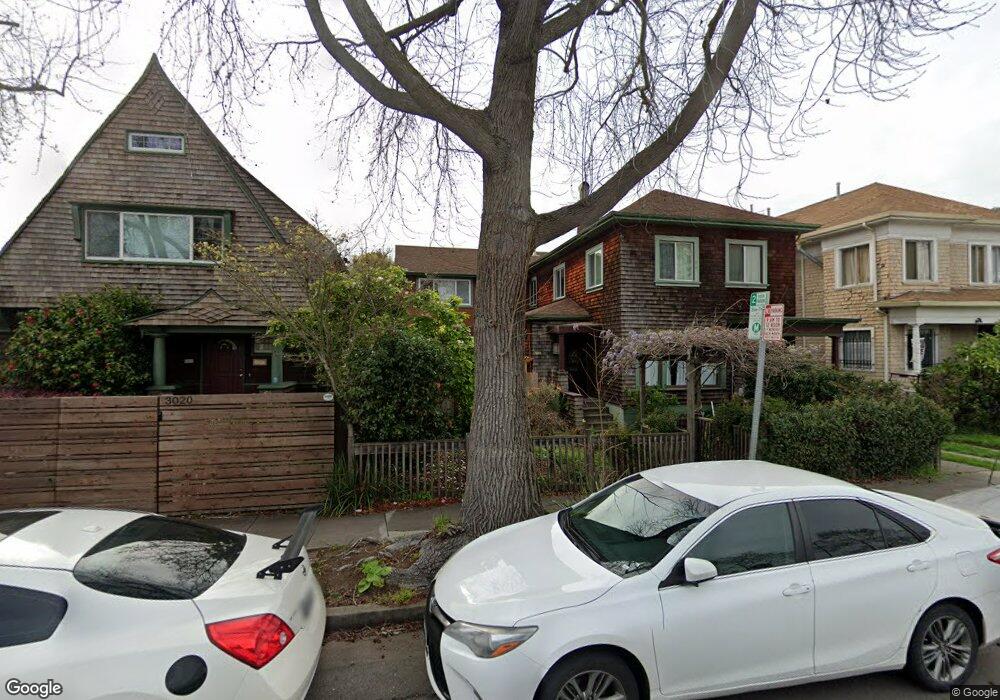
3018 Martin Luther King jr Way Berkeley, CA 94703
South Berkeley NeighborhoodEstimated Value: $866,000 - $1,504,306
5
Beds
3
Baths
2,647
Sq Ft
$481/Sq Ft
Est. Value
About This Home
This home is located at 3018 Martin Luther King jr Way, Berkeley, CA 94703 and is currently estimated at $1,274,327, approximately $481 per square foot. 3018 Martin Luther King jr Way is a home located in Alameda County with nearby schools including Malcolm X Elementary School, Emerson Elementary School, and John Muir Elementary School.
Ownership History
Date
Name
Owned For
Owner Type
Purchase Details
Closed on
Apr 21, 2009
Sold by
Hsbc Bank Usa National Association
Bought by
Sullivan Christopher
Current Estimated Value
Home Financials for this Owner
Home Financials are based on the most recent Mortgage that was taken out on this home.
Original Mortgage
$417,000
Interest Rate
5.59%
Mortgage Type
FHA
Purchase Details
Closed on
Oct 25, 2007
Sold by
Wilson Lenter Magdalene A
Bought by
Hsbc Bank Usa Na and Nomura Home Equity Loan Inc Asset Backed
Purchase Details
Closed on
May 5, 2006
Sold by
Holman Donald and Estate Of William F Holman Jr
Bought by
Wilson Letner Magdalene A
Home Financials for this Owner
Home Financials are based on the most recent Mortgage that was taken out on this home.
Original Mortgage
$174,600
Interest Rate
6.29%
Mortgage Type
Fannie Mae Freddie Mac
Create a Home Valuation Report for This Property
The Home Valuation Report is an in-depth analysis detailing your home's value as well as a comparison with similar homes in the area
Home Values in the Area
Average Home Value in this Area
Purchase History
| Date | Buyer | Sale Price | Title Company |
|---|---|---|---|
| Sullivan Christopher | $425,000 | Fidelity National Title Co | |
| Hsbc Bank Usa Na | $637,500 | None Available | |
| Wilson Letner Magdalene A | $873,000 | Alliance Title Company | |
| Bendich Ina L | -- | Alliance Title Company |
Source: Public Records
Mortgage History
| Date | Status | Borrower | Loan Amount |
|---|---|---|---|
| Previous Owner | Sullivan Christopher | $417,000 | |
| Previous Owner | Bendich Ina L | $174,600 | |
| Previous Owner | Wilson Letner Magdalene A | $698,400 |
Source: Public Records
Tax History Compared to Growth
Tax History
| Year | Tax Paid | Tax Assessment Tax Assessment Total Assessment is a certain percentage of the fair market value that is determined by local assessors to be the total taxable value of land and additions on the property. | Land | Improvement |
|---|---|---|---|---|
| 2025 | $13,319 | $580,965 | $164,568 | $416,397 |
| 2024 | $13,319 | $569,577 | $161,342 | $408,235 |
| 2023 | $12,754 | $545,410 | $158,179 | $387,231 |
| 2022 | $12,777 | $534,718 | $155,078 | $379,640 |
| 2021 | $13,827 | $524,237 | $152,038 | $372,199 |
| 2020 | $10,994 | $518,865 | $150,480 | $368,385 |
| 2019 | $10,441 | $508,692 | $147,530 | $361,162 |
| 2018 | $10,208 | $498,721 | $144,638 | $354,083 |
| 2017 | $9,832 | $488,943 | $141,802 | $347,141 |
| 2016 | $9,408 | $479,360 | $139,023 | $340,337 |
| 2015 | $9,252 | $472,163 | $136,936 | $335,227 |
| 2014 | $8,974 | $447,515 | $134,254 | $313,261 |
Source: Public Records
Map
Nearby Homes
- 2946 Harper St
- 2057 Emerson St
- 2918 Newbury St
- 3038 Shattuck Ave
- 3050 Shattuck Ave
- 6525 Dover St
- 1628 Tyler St
- 2110 Ashby Ave
- 2051 Oregon St
- 3233 Ellis St
- 1614 Russell St
- 1538 Ashby Ave
- 2829 California St
- 2180 Ashby Ave
- 641 63rd St
- 3101 Sacramento St
- 3109 Sacramento St
- 669 Alcatraz Ave
- 667 & 667A Alcatraz Ave
- 667 Alcatraz Ave
- 3014 Martin Luther King jr Way
- 3020 Martin Luther King jr Way
- 3012 Martin Luther King jr Way
- 3026 Martin Luther King jr Way
- 3010 Marting Luther King
- 3010 Martin Luther King jr Way
- 3017 Harper St
- 3019 Harper St
- 3041 Martin Luther King Junior Way
- 3028 Martin Luther King jr Way
- 3015 Harper St
- 3025 Harper St
- 3006 Martin Luther King jr Way
- 3009 Harper St
- 3027 Harper St
- 3032 Martin Luther King jr Way
- 3004 Martin Luther King jr Way
- 3005 Harper St
- 1888 Ashby Ave
- 3033 Harper St