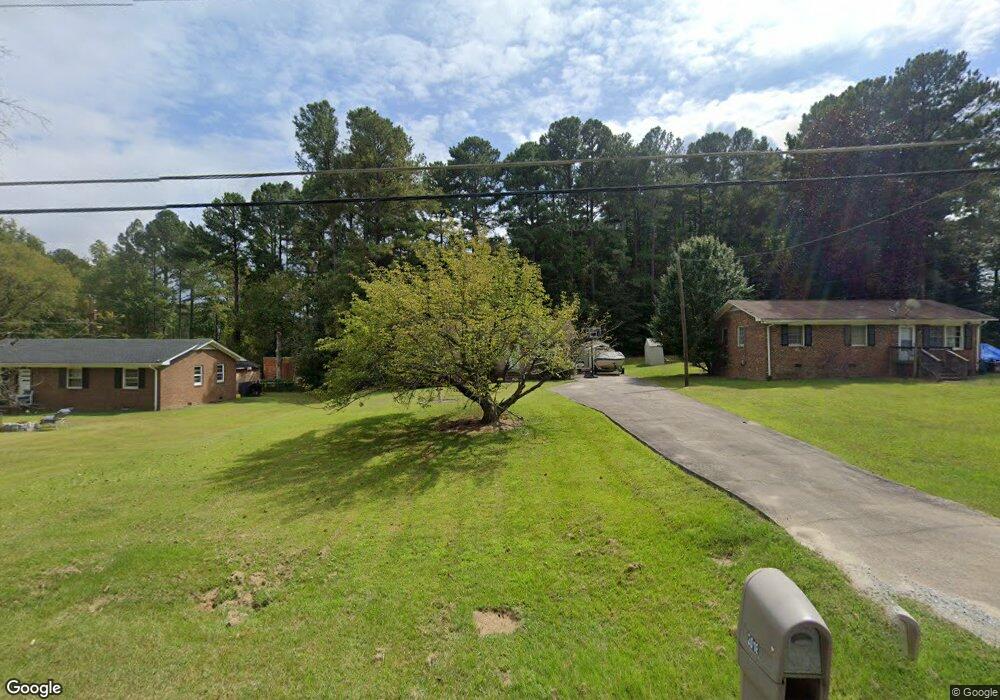
3018 Ross Rd Durham, NC 27703
Eastern Durham NeighborhoodEstimated Value: $254,322 - $291,000
3
Beds
2
Baths
1,025
Sq Ft
$260/Sq Ft
Est. Value
About This Home
This home is located at 3018 Ross Rd, Durham, NC 27703 and is currently estimated at $266,081, approximately $259 per square foot. 3018 Ross Rd is a home located in Durham County with nearby schools including Oak Grove Elementary, John W Neal Middle School, and Southern School of Energy & Sustainability.
Ownership History
Date
Name
Owned For
Owner Type
Purchase Details
Closed on
Jul 21, 2021
Sold by
Stephenson Sybil Hope and Stephenson Sybil B
Bought by
Hill Michael David
Current Estimated Value
Home Financials for this Owner
Home Financials are based on the most recent Mortgage that was taken out on this home.
Original Mortgage
$88,000
Outstanding Balance
$67,329
Interest Rate
2.96%
Mortgage Type
New Conventional
Estimated Equity
$198,752
Purchase Details
Closed on
Jun 16, 2008
Sold by
Stephenson Thomas Lewis
Bought by
Stephenson Sybil B
Create a Home Valuation Report for This Property
The Home Valuation Report is an in-depth analysis detailing your home's value as well as a comparison with similar homes in the area
Home Values in the Area
Average Home Value in this Area
Purchase History
| Date | Buyer | Sale Price | Title Company |
|---|---|---|---|
| Hill Michael David | $110,000 | None Available | |
| Stephenson Sybil B | -- | None Available |
Source: Public Records
Mortgage History
| Date | Status | Borrower | Loan Amount |
|---|---|---|---|
| Open | Hill Michael David | $88,000 |
Source: Public Records
Tax History
| Year | Tax Paid | Tax Assessment Tax Assessment Total Assessment is a certain percentage of the fair market value that is determined by local assessors to be the total taxable value of land and additions on the property. | Land | Improvement |
|---|---|---|---|---|
| 2025 | $2,361 | $238,214 | $91,650 | $146,564 |
| 2024 | $1,768 | $126,747 | $31,635 | $95,112 |
| 2023 | $1,660 | $126,747 | $31,635 | $95,112 |
| 2022 | $1,622 | $126,747 | $31,635 | $95,112 |
| 2021 | $1,615 | $126,747 | $31,635 | $95,112 |
| 2020 | $1,577 | $126,747 | $31,635 | $95,112 |
| 2019 | $1,577 | $126,747 | $31,635 | $95,112 |
| 2018 | $1,143 | $84,288 | $21,090 | $63,198 |
| 2017 | $1,135 | $84,288 | $21,090 | $63,198 |
| 2016 | $1,097 | $84,288 | $21,090 | $63,198 |
| 2015 | $1,213 | $87,655 | $22,059 | $65,596 |
| 2014 | $1,213 | $87,655 | $22,059 | $65,596 |
Source: Public Records
Map
Nearby Homes
- 339 Kilarney Dr
- 209 Fountain St
- 217 Fountain St
- 3033 Fenimore St
- 1007 Shovelhead Dr Unit 4
- 1007 Shovelhead Dr
- 703 Chopper Ln Unit 12
- 431 Princess Anne Dr
- 3004 Cathy Dr
- 110 N Woodcrest St
- 7 Mercury Ct
- 2028 Seford Dr
- 0 Seford Dr
- 3021 Worthy Way
- 403 Chadbourne Dr
- 1002 Alpha Dr
- 106 S Adams St
- 404 Lynn Rd
- 207 S Adams St
- 509 Walton St
Your Personal Tour Guide
Ask me questions while you tour the home.