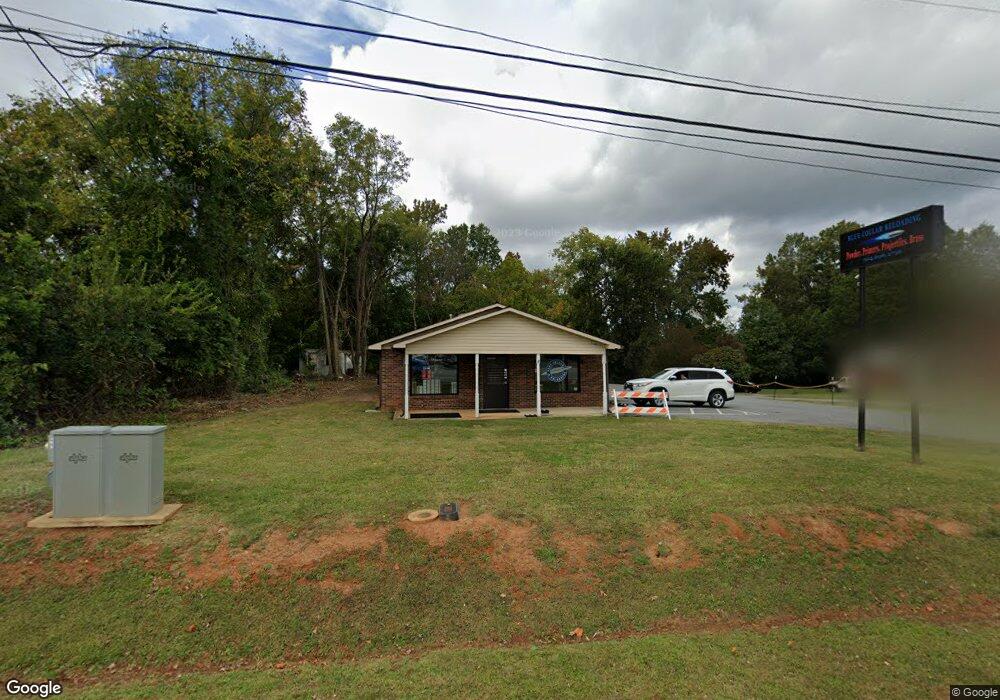
3018 S Main St Unit NULL Salisbury, NC 28147
Estimated Value: $229,808
Studio
--
Bath
1,560
Sq Ft
$147/Sq Ft
Est. Value
About This Home
This home is located at 3018 S Main St Unit NULL, Salisbury, NC 28147 and is currently estimated at $229,808, approximately $147 per square foot. 3018 S Main St Unit NULL is a home located in Rowan County with nearby schools including Knollwood Elementary School, North Rowan Middle School, and Salisbury High School.
Ownership History
Date
Name
Owned For
Owner Type
Purchase Details
Closed on
Nov 8, 2022
Sold by
B Holt Llc
Bought by
Sierra Holding Llc
Current Estimated Value
Home Financials for this Owner
Home Financials are based on the most recent Mortgage that was taken out on this home.
Original Mortgage
$170,000
Outstanding Balance
$164,719
Interest Rate
6.94%
Mortgage Type
New Conventional
Estimated Equity
$65,089
Purchase Details
Closed on
Apr 28, 2020
Sold by
Rainy Day Investments Llc
Bought by
B Holt Llc
Home Financials for this Owner
Home Financials are based on the most recent Mortgage that was taken out on this home.
Original Mortgage
$157,250
Interest Rate
3.3%
Mortgage Type
Future Advance Clause Open End Mortgage
Purchase Details
Closed on
Aug 1, 2013
Bought by
Rainy Day Investments Llc
Purchase Details
Closed on
Feb 25, 2011
Sold by
Coates Timothy H and Coates Lisa B
Bought by
Turman Real Estate Holdings Llc
Create a Home Valuation Report for This Property
The Home Valuation Report is an in-depth analysis detailing your home's value as well as a comparison with similar homes in the area
Purchase History
| Date | Buyer | Sale Price | Title Company |
|---|---|---|---|
| Sierra Holding Llc | $200,000 | -- | |
| B Holt Llc | $185,000 | None Available | |
| Rainy Day Investments Llc | $150,000 | -- | |
| Turman Real Estate Holdings Llc | $100,000 | None Available |
Source: Public Records
Mortgage History
| Date | Status | Borrower | Loan Amount |
|---|---|---|---|
| Open | Sierra Holding Llc | $170,000 | |
| Previous Owner | B Holt Llc | $157,250 |
Source: Public Records
Tax History
| Year | Tax Paid | Tax Assessment Tax Assessment Total Assessment is a certain percentage of the fair market value that is determined by local assessors to be the total taxable value of land and additions on the property. | Land | Improvement |
|---|---|---|---|---|
| 2025 | $1,875 | $156,811 | $50,500 | $106,311 |
| 2024 | $1,875 | $156,811 | $50,500 | $106,311 |
| 2023 | $1,875 | $156,811 | $50,500 | $106,311 |
| 2022 | $1,835 | $133,224 | $50,500 | $82,724 |
| 2021 | $1,835 | $133,224 | $50,500 | $82,724 |
| 2020 | $1,835 | $133,224 | $50,500 | $82,724 |
| 2019 | $1,835 | $133,224 | $50,500 | $82,724 |
| 2018 | $1,660 | $122,179 | $50,500 | $71,679 |
| 2017 | $1,651 | $122,179 | $50,500 | $71,679 |
| 2016 | $1,606 | $122,179 | $50,500 | $71,679 |
| 2015 | $1,616 | $122,179 | $50,500 | $71,679 |
| 2014 | $1,738 | $132,990 | $32,825 | $100,165 |
Source: Public Records
Map
Nearby Homes
- 227 Nesbitt Dr
- 0 S Main St Unit CAR4336153
- 419 Winsley Dr
- 418 Winsley Dr
- 0 Suzannes Rd
- 2260 Cranberry Way
- 1020 Suzannes Rd
- 0 601 Hwy Unit CAR4336269
- 110 Par Dr
- 0 W Jake Alexander Blvd Unit CAR4042762
- 709 Sunset Dr
- 402 Swaim Ct
- 704 Colby Cir
- 1950 Rosemont St
- 0 W D Ave Unit C
- 1212 Rowan Mills Rd
- 204 W C Ave
- 701 Airport Rd
- 405 Klumac Rd
- 1050 Julian Rd
- 3018 S Main St
- 3014 S Main St
- 122 Red Acres Rd
- 3010 S Main St
- 202 Red Acres Rd
- 3102 S Main St
- 3006 S Main St
- 3018 Raymond Ave
- 121 Red Acres Rd
- 206 Red Acres Rd
- 3005 S Main St
- 3005 S Main St Unit NULL
- 3012 Raymond Ave
- 3008 Raymond Ave
- 3002 S Main St
- 3111 Raymond Ave
- 210 Red Acres Rd
- 3106 Raymond Ave
- 3115 Raymond Ave
- 3016 S Main St
Your Personal Tour Guide
Ask me questions while you tour the home.