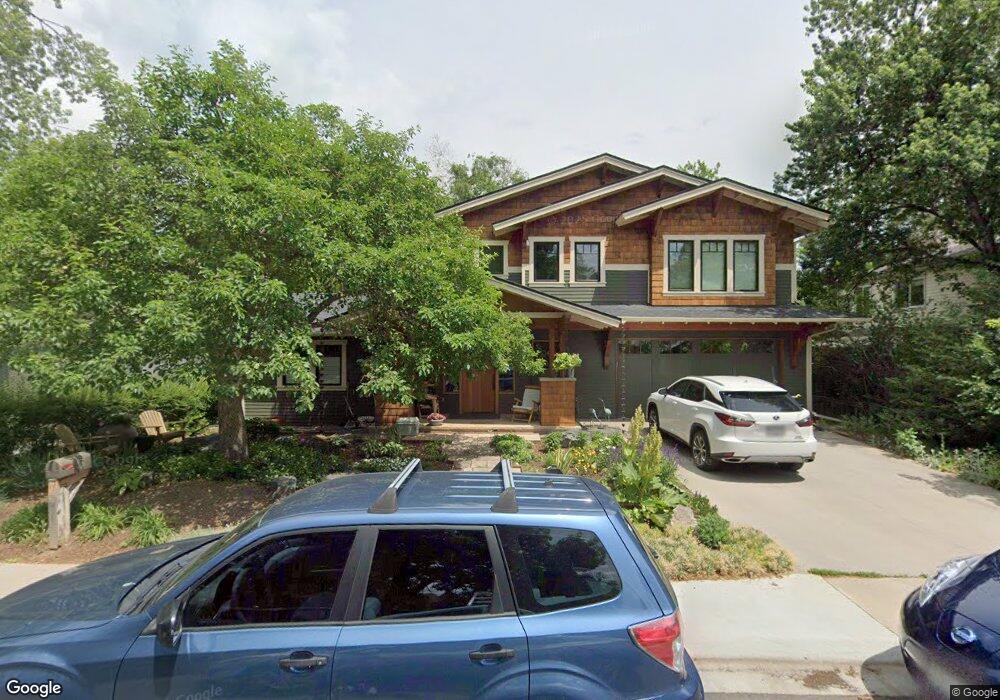
3018 Washington St Boulder, CO 80304
Central Boulder NeighborhoodEstimated Value: $1,904,000 - $2,269,044
4
Beds
3
Baths
2,981
Sq Ft
$711/Sq Ft
Est. Value
About This Home
This home is located at 3018 Washington St, Boulder, CO 80304 and is currently estimated at $2,118,015, approximately $710 per square foot. 3018 Washington St is a home located in Boulder County with nearby schools including Columbine Elementary School, Casey Middle School, and Boulder High School.
Ownership History
Date
Name
Owned For
Owner Type
Purchase Details
Closed on
Apr 18, 2016
Sold by
2741 Mapleton 2 Llc
Bought by
Smart Dieter A
Current Estimated Value
Home Financials for this Owner
Home Financials are based on the most recent Mortgage that was taken out on this home.
Original Mortgage
$500,000
Outstanding Balance
$397,870
Interest Rate
3.73%
Mortgage Type
New Conventional
Estimated Equity
$1,720,145
Purchase Details
Closed on
Sep 9, 2013
Sold by
Smart Dieter A and Smart Hildie L
Bought by
2741 Mapleton 2 Llc
Home Financials for this Owner
Home Financials are based on the most recent Mortgage that was taken out on this home.
Original Mortgage
$250,000
Interest Rate
4%
Mortgage Type
Seller Take Back
Purchase Details
Closed on
Aug 11, 1986
Bought by
Smart Dieter A and Smart Hildie L
Create a Home Valuation Report for This Property
The Home Valuation Report is an in-depth analysis detailing your home's value as well as a comparison with similar homes in the area
Home Values in the Area
Average Home Value in this Area
Purchase History
| Date | Buyer | Sale Price | Title Company |
|---|---|---|---|
| Smart Dieter A | $985,000 | Land Title Guarantee Company | |
| 2741 Mapleton 2 Llc | $650,000 | Land Title Guarantee Company | |
| Smart Dieter A | -- | -- |
Source: Public Records
Mortgage History
| Date | Status | Borrower | Loan Amount |
|---|---|---|---|
| Open | Smart Dieter A | $500,000 | |
| Previous Owner | 2741 Mapleton 2 Llc | $250,000 |
Source: Public Records
Tax History Compared to Growth
Tax History
| Year | Tax Paid | Tax Assessment Tax Assessment Total Assessment is a certain percentage of the fair market value that is determined by local assessors to be the total taxable value of land and additions on the property. | Land | Improvement |
|---|---|---|---|---|
| 2025 | $13,768 | $143,675 | $56,856 | $86,819 |
| 2024 | $13,768 | $143,675 | $56,856 | $86,819 |
| 2023 | $13,530 | $156,666 | $60,206 | $100,145 |
| 2022 | $11,231 | $120,935 | $45,446 | $75,489 |
| 2021 | $10,709 | $124,415 | $46,754 | $77,661 |
| 2020 | $9,336 | $107,251 | $62,205 | $45,046 |
| 2019 | $9,193 | $107,251 | $62,205 | $45,046 |
| 2018 | $8,141 | $93,895 | $37,512 | $56,383 |
| 2017 | $7,886 | $103,807 | $41,472 | $62,335 |
| 2016 | $7,851 | $33,918 | $30,248 | $3,670 |
| 2015 | $2,780 | $39,450 | $21,412 | $18,038 |
| 2014 | $3,317 | $39,450 | $21,412 | $18,038 |
Source: Public Records
Map
Nearby Homes
- 3010 14th St
- 1237 Elder Ave Unit 1
- 3000 Broadway St Unit 10
- 3000 Broadway St Unit 10 & 11
- 2917 13th St
- 3025 Broadway St Unit 7
- 2935 19th St
- 1267 Balsam Ave
- 1265 Balsam Ave
- 1930 Grape Ave
- 2870 18th St
- 3135 11th St
- 1201 Balsam Ave Unit 203
- 1201 Balsam Ave Unit 201
- 1707 Grape Ave
- 1303 Alpine Ave Unit 24A
- 1023 Forest Ave
- 2941 21st St
- 1895 Alpine Ave Unit G21
- 1895 Alpine Ave Unit E18
- 3020 Washington St
- 3014 Washington St
- 3015 14th St
- 3019 14th St
- 3024 Washington St
- 3010 Washington St
- 3011 14th St
- 3021 14th St
- 3019 Washington St
- 3015 Washington St
- 3021 Washington St
- 3011 Washington St
- 3004 Washington St
- 3030 Washington St
- 3005 14th St
- 3023 14th St
- 3023 Washington St
- 3020 14th St
- 1345 Elder Ave
- 3018 Jefferson St