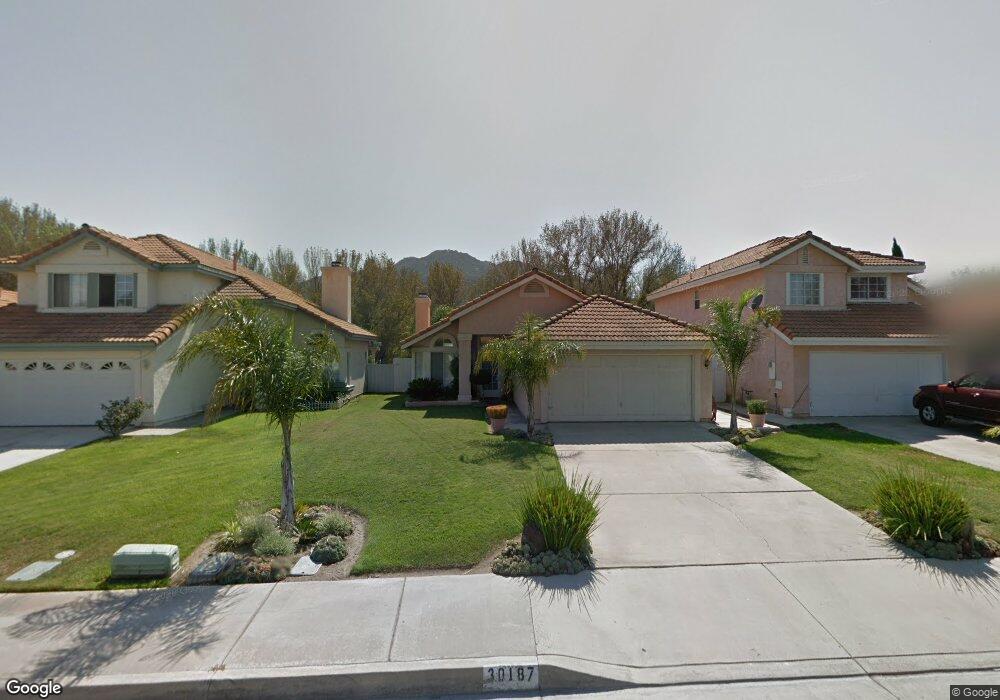
30187 Cupeno Ln Temecula, CA 92592
Estimated Value: $472,000 - $578,000
2
Beds
2
Baths
902
Sq Ft
$594/Sq Ft
Est. Value
About This Home
This home is located at 30187 Cupeno Ln, Temecula, CA 92592 and is currently estimated at $536,012, approximately $594 per square foot. 30187 Cupeno Ln is a home located in Riverside County with nearby schools including Red Hawk Elementary, Erle Stanley Gardner Middle School, and Great Oak High School.
Ownership History
Date
Name
Owned For
Owner Type
Purchase Details
Closed on
Sep 10, 2018
Sold by
Jernegan Richard J and Jernegan Ruth A
Bought by
Jernegan Ruth A and Jernegan Richard J
Current Estimated Value
Home Financials for this Owner
Home Financials are based on the most recent Mortgage that was taken out on this home.
Original Mortgage
$256,000
Outstanding Balance
$223,268
Interest Rate
4.6%
Mortgage Type
New Conventional
Estimated Equity
$312,744
Purchase Details
Closed on
Jul 10, 2001
Sold by
Thompson Stacie
Bought by
Thompson Scott
Home Financials for this Owner
Home Financials are based on the most recent Mortgage that was taken out on this home.
Original Mortgage
$162,450
Interest Rate
7.26%
Mortgage Type
FHA
Purchase Details
Closed on
Jun 16, 2001
Sold by
Thompson Scott
Bought by
Jernegan Richard J and Jernegan Ruth A
Home Financials for this Owner
Home Financials are based on the most recent Mortgage that was taken out on this home.
Original Mortgage
$162,450
Interest Rate
7.26%
Mortgage Type
FHA
Purchase Details
Closed on
Aug 30, 1993
Sold by
Nasby Lora K
Bought by
Thompson Scott
Home Financials for this Owner
Home Financials are based on the most recent Mortgage that was taken out on this home.
Original Mortgage
$105,163
Interest Rate
7.13%
Mortgage Type
FHA
Create a Home Valuation Report for This Property
The Home Valuation Report is an in-depth analysis detailing your home's value as well as a comparison with similar homes in the area
Purchase History
We collect this data history from publicly available records. To have your information removed, we recommend requesting removal directly through your county’s website.
| Date | Buyer | Sale Price | Title Company |
|---|---|---|---|
| Jernegan Ruth A | -- | Corinthian Title | |
| Thompson Scott | -- | American Title | |
| Jernegan Richard J | $165,000 | American Title | |
| Thompson Scott | $105,000 | Continental Lawyers Title Co |
Source: Public Records
Mortgage History
We collect this data history from publicly available records. To have your information removed, we recommend requesting removal directly through your county’s website.
| Date | Status | Borrower | Loan Amount |
|---|---|---|---|
| Open | Jernegan Ruth A | $256,000 | |
| Closed | Jernegan Richard J | $162,450 | |
| Previous Owner | Thompson Scott | $105,163 |
Source: Public Records
Tax History
| Year | Tax Paid | Tax Assessment Tax Assessment Total Assessment is a certain percentage of the fair market value that is determined by local assessors to be the total taxable value of land and additions on the property. | Land | Improvement |
|---|---|---|---|---|
| 2025 | $3,323 | $269,177 | $66,462 | $202,715 |
| 2023 | $3,323 | $258,727 | $63,882 | $194,845 |
| 2022 | $3,212 | $253,655 | $62,630 | $191,025 |
| 2021 | $3,138 | $248,682 | $61,402 | $187,280 |
| 2020 | $3,101 | $246,133 | $60,773 | $185,360 |
| 2019 | $3,053 | $241,308 | $59,582 | $181,726 |
| 2018 | $2,988 | $236,577 | $58,415 | $178,162 |
| 2017 | $2,932 | $231,939 | $57,270 | $174,669 |
| 2016 | $2,876 | $227,393 | $56,148 | $171,245 |
| 2015 | $2,822 | $223,979 | $55,305 | $168,674 |
| 2014 | $2,733 | $219,594 | $54,223 | $165,371 |
Source: Public Records
Map
Nearby Homes
- 30145 Pechanga Dr
- 30225 Pechanga Dr
- 44580 La Paz Rd Unit 45
- 44583 La Paz Rd
- 44535 La Paz Rd Unit A
- 44557 La Paz Rd
- 30381 Pechanga Dr
- 29420 Ynez Rd
- 0 Old Town Front St Unit IV24092006
- 45534 Olympic Way
- 0 E Vallejo Ave
- 44871 Trotsdale Dr
- 30230 De Portola Rd
- 45795 Creekside Way
- 44028 Highlander Dr
- 44004 Northgate Ave
- 5 Vía Gorrion
- 44972 Muirfield Dr
- 43845 Calle de Velardo
- 43982 Highlander Dr
- 30137 Pechanga Dr
- 30171 Pechanga Dr
- 30186 Cupeno Ln
- 30125 Pechanga Dr
- 30193 Pechanga Dr
- 30194 Cupeno Ln
- 30201 Pechanga Dr
- 30202 Cupeno Ln
- 30144 Pechanga Dr
- 30136 Pechanga Dr
- 30152 Pechanga Dr
- 30209 Pechanga Dr
- 30128 Pechanga Dr
- 30160 Pechanga Dr
- 30176 Pechanga Dr
- 30184 Pechanga Dr
- 30168 Pechanga Dr
- 30105 Pechanga Dr
- 30120 Pechanga Dr
- 30194 Pechanga Dr
Your Personal Tour Guide
Ask me questions while you tour the home.