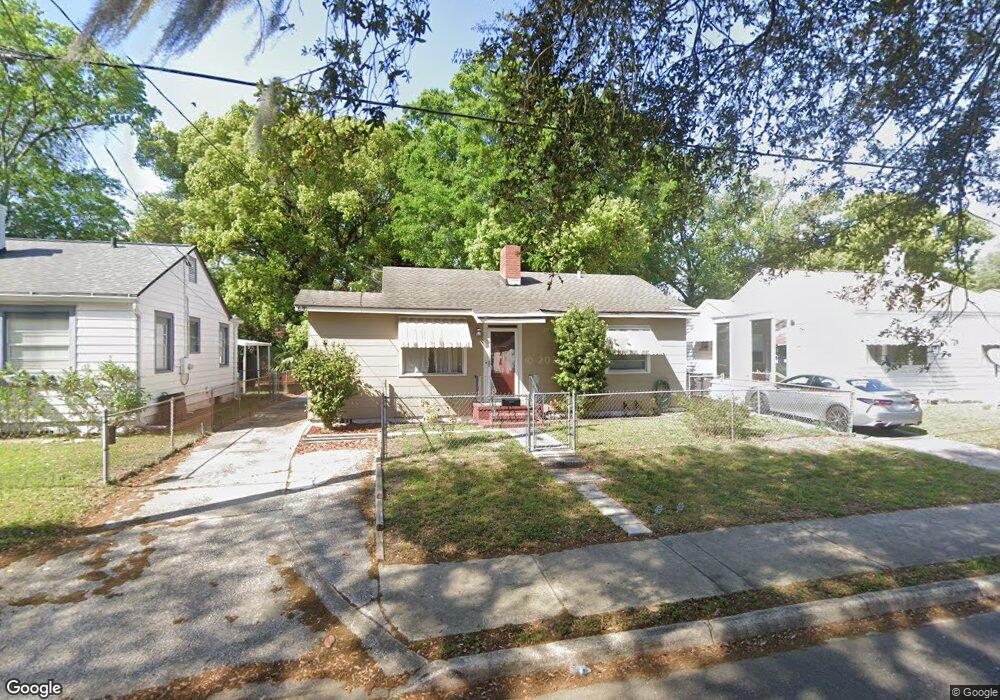
3019 Plum St Jacksonville, FL 32205
Murray Hill NeighborhoodEstimated Value: $184,538 - $232,000
2
Beds
1
Bath
1,247
Sq Ft
$172/Sq Ft
Est. Value
About This Home
This home is located at 3019 Plum St, Jacksonville, FL 32205 and is currently estimated at $214,885, approximately $172 per square foot. 3019 Plum St is a home located in Duval County with nearby schools including Pinedale Elementary School, Lake Shore Middle School, and Riverside High School.
Ownership History
Date
Name
Owned For
Owner Type
Purchase Details
Closed on
Feb 25, 2000
Sold by
Price Gary Lee
Bought by
Price Lore Anne
Current Estimated Value
Purchase Details
Closed on
Dec 29, 1994
Sold by
Estes V Moreau P
Bought by
Price Gary L and Price Lore A
Home Financials for this Owner
Home Financials are based on the most recent Mortgage that was taken out on this home.
Original Mortgage
$45,296
Interest Rate
9.17%
Mortgage Type
FHA
Create a Home Valuation Report for This Property
The Home Valuation Report is an in-depth analysis detailing your home's value as well as a comparison with similar homes in the area
Home Values in the Area
Average Home Value in this Area
Purchase History
| Date | Buyer | Sale Price | Title Company |
|---|---|---|---|
| Price Lore Anne | -- | -- | |
| Price Gary L | $44,900 | -- |
Source: Public Records
Mortgage History
| Date | Status | Borrower | Loan Amount |
|---|---|---|---|
| Closed | Price Gary L | $45,296 |
Source: Public Records
Tax History Compared to Growth
Tax History
| Year | Tax Paid | Tax Assessment Tax Assessment Total Assessment is a certain percentage of the fair market value that is determined by local assessors to be the total taxable value of land and additions on the property. | Land | Improvement |
|---|---|---|---|---|
| 2025 | $1,999 | $103,827 | $47,737 | $56,090 |
| 2024 | $1,891 | $100,031 | $42,275 | $57,756 |
| 2023 | $1,891 | $96,630 | $40,050 | $56,580 |
| 2022 | $1,690 | $93,954 | $40,050 | $53,904 |
| 2021 | $1,692 | $101,163 | $28,925 | $72,238 |
| 2020 | $1,606 | $98,561 | $28,925 | $69,636 |
| 2019 | $1,478 | $85,744 | $21,138 | $64,606 |
| 2018 | $1,415 | $84,197 | $21,138 | $63,059 |
| 2017 | $1,163 | $52,151 | $6,675 | $45,476 |
| 2016 | $1,148 | $51,611 | $0 | $0 |
| 2015 | $1,113 | $51,804 | $0 | $0 |
| 2014 | $1,055 | $49,138 | $0 | $0 |
Source: Public Records
Map
Nearby Homes