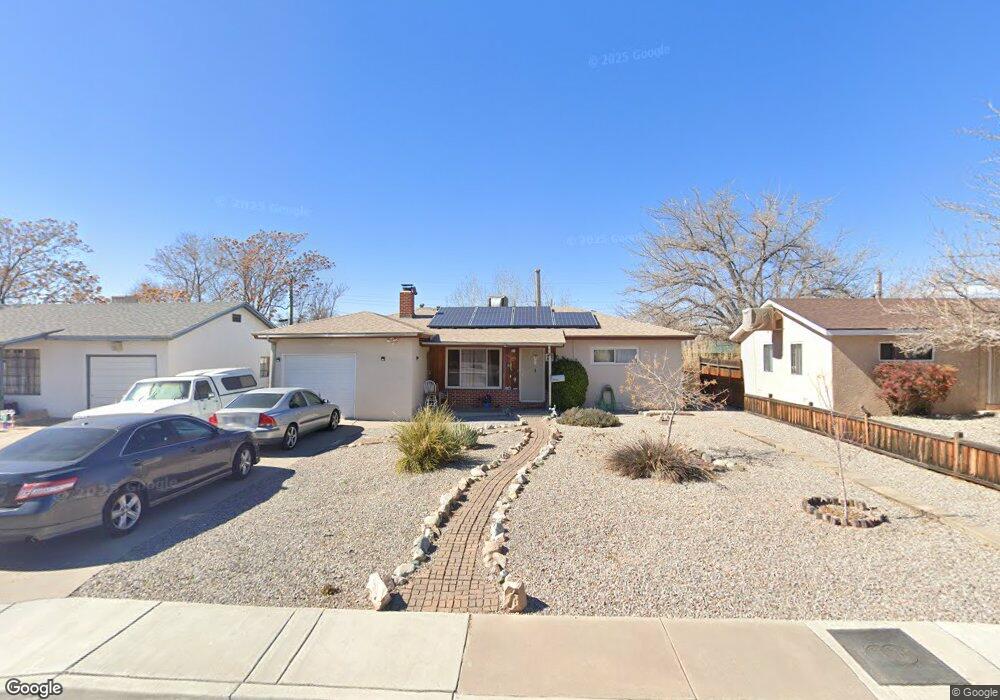
3019 Truman St NE Albuquerque, NM 87110
McKinley NeighborhoodEstimated Value: $193,000 - $249,487
4
Beds
1
Bath
1,200
Sq Ft
$193/Sq Ft
Est. Value
About This Home
This home is located at 3019 Truman St NE, Albuquerque, NM 87110 and is currently estimated at $231,122, approximately $192 per square foot. 3019 Truman St NE is a home located in Bernalillo County with nearby schools including Bel-Air Elementary School, McKinley Middle School, and Del Norte High School.
Ownership History
Date
Name
Owned For
Owner Type
Purchase Details
Closed on
Apr 6, 2011
Sold by
Flores Frank J and Flores Mary S
Bought by
Flores Frank J and Flores Mary S
Current Estimated Value
Purchase Details
Closed on
Feb 3, 2011
Sold by
Deutsche Bank National Trust Company
Bought by
Flores Frank J and Flores Mary S
Purchase Details
Closed on
Sep 21, 2010
Sold by
Mclelland Matthew S
Bought by
Deutsche Bank National Trust Company
Purchase Details
Closed on
Mar 17, 2006
Sold by
Gonzales Patricia and Stephens Steve
Bought by
Mclelland Matthew S and Gonzales Cari A
Home Financials for this Owner
Home Financials are based on the most recent Mortgage that was taken out on this home.
Original Mortgage
$28,580
Interest Rate
6.19%
Mortgage Type
Stand Alone Second
Create a Home Valuation Report for This Property
The Home Valuation Report is an in-depth analysis detailing your home's value as well as a comparison with similar homes in the area
Home Values in the Area
Average Home Value in this Area
Purchase History
| Date | Buyer | Sale Price | Title Company |
|---|---|---|---|
| Flores Frank J | -- | None Available | |
| Flores Frank J | -- | American Southwest Title Llc | |
| Deutsche Bank National Trust Company | $110,925 | None Available | |
| Mclelland Matthew S | -- | Fidelity Natl Title Ins Co |
Source: Public Records
Mortgage History
| Date | Status | Borrower | Loan Amount |
|---|---|---|---|
| Previous Owner | Mclelland Matthew S | $28,580 |
Source: Public Records
Tax History Compared to Growth
Tax History
| Year | Tax Paid | Tax Assessment Tax Assessment Total Assessment is a certain percentage of the fair market value that is determined by local assessors to be the total taxable value of land and additions on the property. | Land | Improvement |
|---|---|---|---|---|
| 2025 | $1,924 | $46,978 | $15,191 | $31,787 |
| 2024 | $1,924 | $45,611 | $14,749 | $30,862 |
| 2023 | $1,892 | $44,282 | $14,319 | $29,963 |
| 2022 | $1,829 | $42,992 | $13,902 | $29,090 |
| 2021 | $1,767 | $41,741 | $13,498 | $28,243 |
| 2020 | $1,738 | $40,526 | $13,105 | $27,421 |
| 2019 | $1,687 | $39,345 | $12,723 | $26,622 |
| 2018 | $1,627 | $39,345 | $12,723 | $26,622 |
| 2017 | $1,577 | $38,200 | $12,353 | $25,847 |
| 2016 | $1,532 | $36,008 | $11,644 | $24,364 |
| 2015 | $34,959 | $34,959 | $11,305 | $23,654 |
| 2014 | $1,441 | $33,941 | $10,976 | $22,965 |
| 2013 | -- | $32,952 | $10,656 | $22,296 |
Source: Public Records
Map
Nearby Homes
- 3010 Quincy St NE
- 3119 Truman St NE
- 2930 Jefferson St NE
- 2826 La Veta Dr NE
- 3301 Monroe St NE Unit N145
- 3125 Cuervo Dr NE
- 2904 Washington St NE
- 2800 Cuervo Dr NE
- 3417 Palomas Dr NE
- 5001 Comanche Rd NE
- 2616 Manzano St NE
- 2920 Cardenas Dr NE
- 3312 Alvarado Dr NE
- 2819 Montclaire Dr NE
- 3014 Aliso Dr NE
- 4513 San Andres Ave NE
- 3026 Aliso Dr NE
- 2529 Cardenas Dr NE
- 3001 Aliso Dr NE
- 3900 Ortiz Ct NE Unit A
- 3015 Truman St NE
- 3023 Truman St NE
- 3018 Manzano St NE
- 3011 Truman St NE
- 3014 Manzano St NE
- 3027 Truman St NE
- 3022 Manzano St NE
- 3022 Truman St NE
- 3018 Truman St NE
- 3014 Truman St NE
- 3010 Manzano St NE
- 3026 Manzano St NE
- 3007 Truman St NE
- 3010 Truman St NE
- 3031 Truman St NE
- 3026 Truman St NE
- 3006 Manzano St NE
- 3030 Manzano St NE
- 3006 Truman St NE
- 3030 Truman St NE