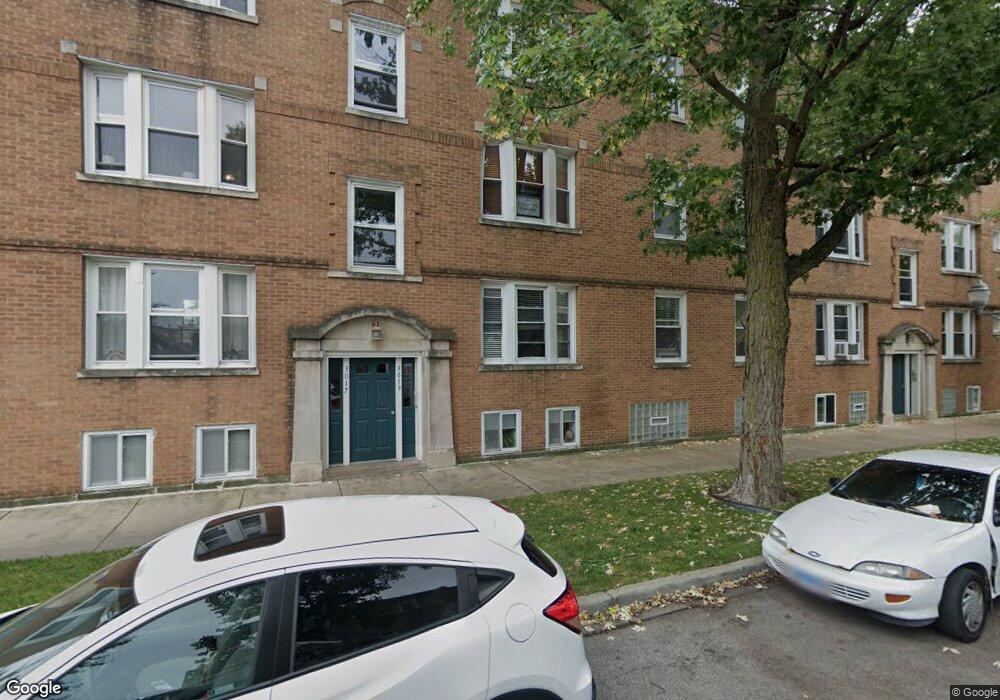
3019 W Cullom Ave Unit 30192 Chicago, IL 60618
Irving Park NeighborhoodEstimated Value: $225,000 - $238,000
2
Beds
1
Bath
900
Sq Ft
$257/Sq Ft
Est. Value
About This Home
This home is located at 3019 W Cullom Ave Unit 30192, Chicago, IL 60618 and is currently estimated at $231,371, approximately $257 per square foot. 3019 W Cullom Ave Unit 30192 is a home located in Cook County with nearby schools including Bateman Elementary School, Roosevelt High School, and CICS Irving Park.
Ownership History
Date
Name
Owned For
Owner Type
Purchase Details
Closed on
May 6, 2025
Sold by
Helderman Trina N
Bought by
Russo-Albanese Nicholas M
Current Estimated Value
Home Financials for this Owner
Home Financials are based on the most recent Mortgage that was taken out on this home.
Original Mortgage
$218,500
Outstanding Balance
$217,741
Interest Rate
6.75%
Mortgage Type
New Conventional
Estimated Equity
$13,630
Purchase Details
Closed on
Jun 2, 2004
Sold by
3414 Cullom Llc
Bought by
Helderman Trina N
Home Financials for this Owner
Home Financials are based on the most recent Mortgage that was taken out on this home.
Original Mortgage
$136,000
Interest Rate
5.12%
Mortgage Type
New Conventional
Create a Home Valuation Report for This Property
The Home Valuation Report is an in-depth analysis detailing your home's value as well as a comparison with similar homes in the area
Home Values in the Area
Average Home Value in this Area
Purchase History
| Date | Buyer | Sale Price | Title Company |
|---|---|---|---|
| Russo-Albanese Nicholas M | $230,000 | Proper Title | |
| Helderman Trina N | $170,000 | Multiple |
Source: Public Records
Mortgage History
| Date | Status | Borrower | Loan Amount |
|---|---|---|---|
| Open | Russo-Albanese Nicholas M | $218,500 | |
| Previous Owner | Helderman Trina N | $136,000 | |
| Closed | Helderman Trina N | $34,000 |
Source: Public Records
Tax History Compared to Growth
Tax History
| Year | Tax Paid | Tax Assessment Tax Assessment Total Assessment is a certain percentage of the fair market value that is determined by local assessors to be the total taxable value of land and additions on the property. | Land | Improvement |
|---|---|---|---|---|
| 2024 | $2,819 | $17,321 | $1,720 | $15,601 |
| 2023 | $2,726 | $16,630 | $1,387 | $15,243 |
| 2022 | $2,726 | $16,630 | $1,387 | $15,243 |
| 2021 | $2,683 | $16,628 | $1,386 | $15,242 |
| 2020 | $2,473 | $14,163 | $610 | $13,553 |
| 2019 | $2,488 | $15,771 | $610 | $15,161 |
| 2018 | $2,445 | $15,771 | $610 | $15,161 |
| 2017 | $1,640 | $10,968 | $554 | $10,414 |
| 2016 | $1,702 | $10,968 | $554 | $10,414 |
| 2015 | $1,534 | $10,968 | $554 | $10,414 |
| 2014 | $1,488 | $10,558 | $499 | $10,059 |
| 2013 | $1,447 | $10,558 | $499 | $10,059 |
Source: Public Records
Map
Nearby Homes
- 4316 N Albany Ave Unit 1
- 4343 N Sacramento Ave Unit A-G
- 4307 N Troy St Unit 1
- 4347 N Richmond St Unit 1N
- 4347 N Richmond St Unit 1S
- 4347 N Richmond St Unit 3N
- 4347 N Richmond St Unit 2N
- 3102 W Berteau Ave Unit 31023
- 4343 N Richmond St Unit 1S
- 4333 N Troy St Unit 3E
- 4411 N Sacramento Ave Unit 1
- 4231 N Kedzie Ave Unit 3E
- 4425 N Sacramento Ave
- 4229 N Kedzie Ave
- 4437 N Whipple St
- 4410 N Troy St Unit 101
- 4141 N Kedzie Ave Unit 307
- 4251 N Mozart St Unit 2S
- 4251 N Mozart St Unit S2
- 3055 W Sunnyside Ave Unit 1
- 3021 W Cullom Ave Unit 2
- 3019 W Cullom Ave Unit 30193
- 3019 W Cullom Ave Unit 30191
- 3021 W Cullom Ave Unit 30211
- 3021 W Cullom Ave Unit 30213
- 3021 W Cullom Ave Unit 30212
- 3019 W Cullom Ave Unit 3
- 3021 W Cullom Ave Unit 3
- 3017 W Cullom Ave Unit 30171
- 3017 W Cullom Ave Unit 30173
- 3017 W Cullom Ave Unit 30172
- 3017 W Cullom Ave Unit 2
- 3023 W Cullom Ave Unit 30231
- 3023 W Cullom Ave Unit 30232
- 3023 W Cullom Ave Unit 30233
- 3023 W Cullom Ave Unit 3
- 3023 W Cullom Ave Unit 2
- 4255 N Whipple St
- 4251 N Whipple St
- 4301 N Whipple St