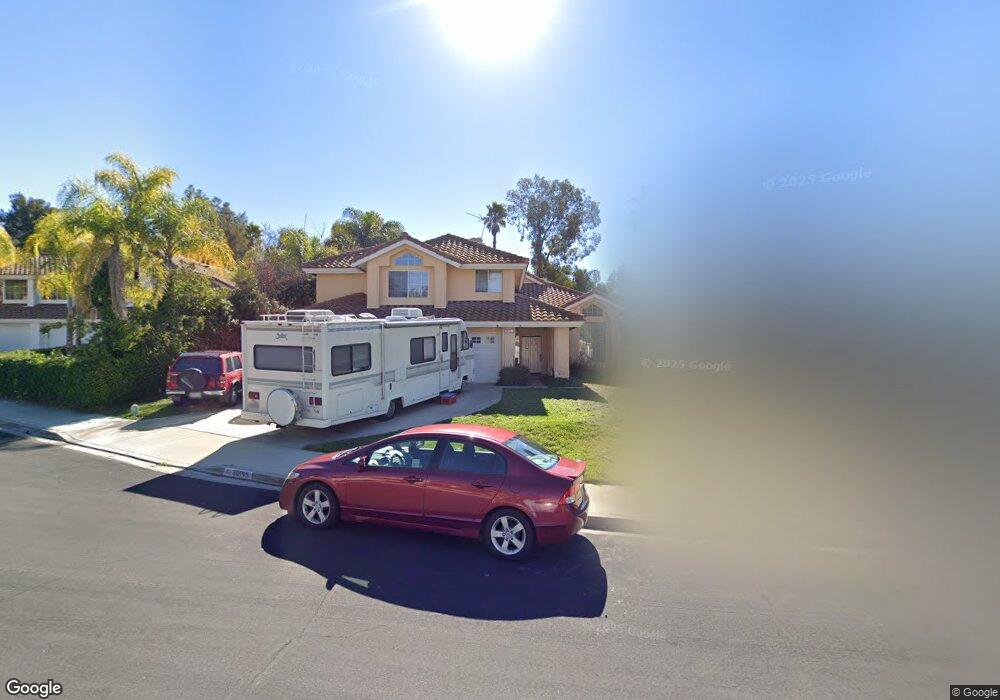
30195 Corte Cantera Temecula, CA 92591
Estimated Value: $737,000 - $821,000
4
Beds
3
Baths
2,343
Sq Ft
$334/Sq Ft
Est. Value
About This Home
This home is located at 30195 Corte Cantera, Temecula, CA 92591 and is currently estimated at $783,424, approximately $334 per square foot. 30195 Corte Cantera is a home located in Riverside County with nearby schools including Temecula Elementary School, James L. Day Middle School, and Chaparral High School.
Ownership History
Date
Name
Owned For
Owner Type
Purchase Details
Closed on
Oct 6, 1999
Sold by
Quirk Gail A
Bought by
Burdge John and Burdge Gina
Current Estimated Value
Home Financials for this Owner
Home Financials are based on the most recent Mortgage that was taken out on this home.
Original Mortgage
$182,400
Outstanding Balance
$54,443
Interest Rate
7.68%
Estimated Equity
$728,981
Create a Home Valuation Report for This Property
The Home Valuation Report is an in-depth analysis detailing your home's value as well as a comparison with similar homes in the area
Purchase History
| Date | Buyer | Sale Price | Title Company |
|---|---|---|---|
| Burdge John | $228,000 | Chicago Title Co |
Source: Public Records
Mortgage History
| Date | Status | Borrower | Loan Amount |
|---|---|---|---|
| Open | Burdge John | $182,400 |
Source: Public Records
Tax History
| Year | Tax Paid | Tax Assessment Tax Assessment Total Assessment is a certain percentage of the fair market value that is determined by local assessors to be the total taxable value of land and additions on the property. | Land | Improvement |
|---|---|---|---|---|
| 2025 | $4,304 | $350,398 | $61,461 | $288,937 |
| 2023 | $4,304 | $336,793 | $59,075 | $277,718 |
| 2022 | $4,170 | $330,190 | $57,917 | $272,273 |
| 2021 | $4,082 | $323,717 | $56,782 | $266,935 |
| 2020 | $4,037 | $320,398 | $56,200 | $264,198 |
| 2019 | $3,978 | $314,117 | $55,099 | $259,018 |
| 2018 | $3,899 | $307,959 | $54,020 | $253,939 |
| 2017 | $3,830 | $301,921 | $52,961 | $248,960 |
| 2016 | $3,759 | $296,002 | $51,923 | $244,079 |
| 2015 | $3,693 | $291,557 | $51,144 | $240,413 |
| 2014 | $3,583 | $285,848 | $50,144 | $235,704 |
Source: Public Records
Map
Nearby Homes
- 30041 Los Nogales Rd
- 30006 Corte Cantera
- 41480 Luz Del Sol
- 41070 Avenida Verde
- 29922 Avenida Cima Del Sol
- 29774 Calle Pantano
- 42045 Veneto Dr
- 42107 Paseo Rayo Del Sol
- 42040 Teatree Ct
- 41552 Willow Run Rd
- 29726 Vail Brook Dr
- 29786 Via Puesta Del Sol
- 0 Rancho California Rd Unit SW25173776
- 0 Rancho California Rd Unit NP26010173
- 30770 Avenida Buena Suerte
- 31130 S General Kearny Rd Unit 89
- 31130 S General Kearny Rd Unit 145
- 31130 S General Kearny Rd Unit 147
- 31130 S General Kearny Rd Unit 77
- 31130 S General Kearny Rd Unit 134
- 30173 Corte Cantera
- 30199 Corte Cantera
- 30161 Corte Cantera
- 30219 Corte Cantera
- 30202 Corte Plata
- 30184 Corte Plata
- 30149 Corte Cantera
- 30231 Corte Cantera
- 30166 Corte Plata
- 30220 Corte Plata
- 30208 Corte Cantera
- 30222 Corte Cantera
- 30174 Corte Cantera
- 30196 Corte Cantera
- 30137 Corte Cantera
- 30162 Corte Cantera
- 30148 Corte Plata
- 30150 Corte Cantera
- 30238 Corte Plata
- 30125 Corte Cantera
Your Personal Tour Guide
Ask me questions while you tour the home.