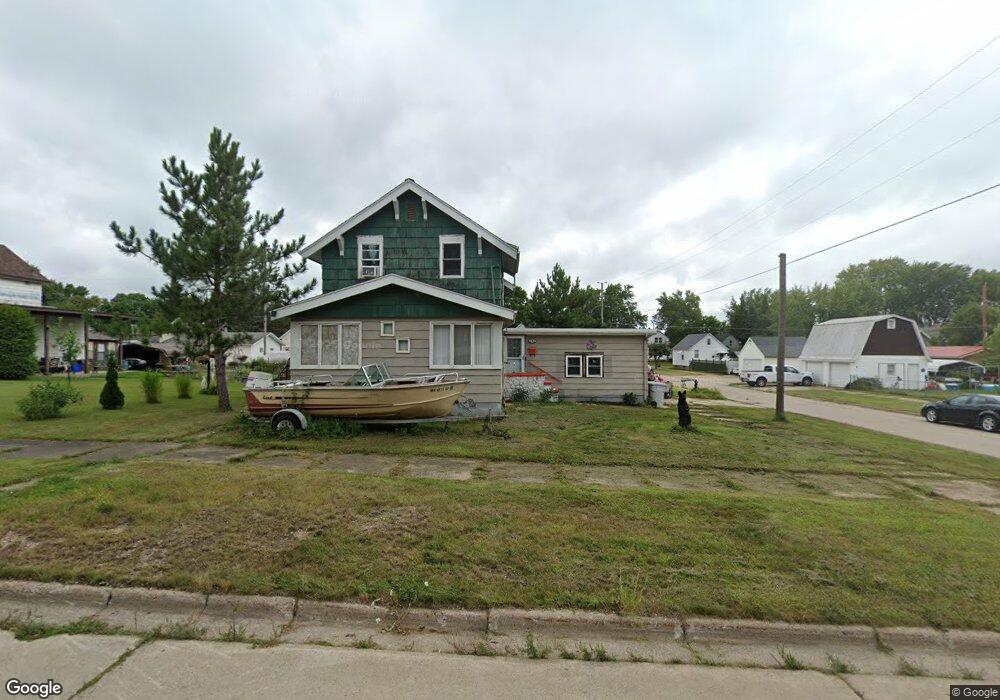
302 1/2 8th St SW Chisholm, MN 55719
Estimated Value: $119,592 - $136,000
5
Beds
2
Baths
1,675
Sq Ft
$74/Sq Ft
Est. Value
About This Home
This home is located at 302 1/2 8th St SW, Chisholm, MN 55719 and is currently estimated at $124,398, approximately $74 per square foot. 302 1/2 8th St SW is a home located in St. Louis County with nearby schools including Vaughan Elementary School, Chisholm Elementary School, and Chisholm Secondary School.
Ownership History
Date
Name
Owned For
Owner Type
Purchase Details
Closed on
Jun 1, 2015
Sold by
Not Provided
Bought by
Not Provided Jodi L
Current Estimated Value
Home Financials for this Owner
Home Financials are based on the most recent Mortgage that was taken out on this home.
Original Mortgage
$55,967
Outstanding Balance
$44,723
Interest Rate
4.75%
Mortgage Type
FHA
Estimated Equity
$79,675
Purchase Details
Closed on
Jun 10, 2009
Sold by
Samsa Augustine and Samsa Dorothy May
Bought by
Samsa Daniel J and Peterson Connie
Create a Home Valuation Report for This Property
The Home Valuation Report is an in-depth analysis detailing your home's value as well as a comparison with similar homes in the area
Home Values in the Area
Average Home Value in this Area
Purchase History
| Date | Buyer | Sale Price | Title Company |
|---|---|---|---|
| Not Provided Jodi L | $57,000 | Northeast Title Company | |
| Samsa Daniel J | -- | None Available |
Source: Public Records
Mortgage History
| Date | Status | Borrower | Loan Amount |
|---|---|---|---|
| Open | Not Provided Jodi L | $55,967 |
Source: Public Records
Tax History Compared to Growth
Tax History
| Year | Tax Paid | Tax Assessment Tax Assessment Total Assessment is a certain percentage of the fair market value that is determined by local assessors to be the total taxable value of land and additions on the property. | Land | Improvement |
|---|---|---|---|---|
| 2024 | $556 | $88,900 | $7,700 | $81,200 |
| 2023 | $556 | $84,500 | $7,700 | $76,800 |
| 2022 | $328 | $65,400 | $5,900 | $59,500 |
| 2021 | $382 | $58,400 | $3,500 | $54,900 |
| 2020 | $342 | $58,400 | $3,500 | $54,900 |
| 2019 | $314 | $58,400 | $3,500 | $54,900 |
| 2018 | $278 | $54,600 | $3,500 | $51,100 |
| 2017 | $264 | $54,600 | $3,500 | $51,100 |
| 2016 | $288 | $53,600 | $5,500 | $48,100 |
| 2015 | $353 | $32,200 | $3,300 | $28,900 |
| 2014 | $353 | $31,700 | $3,300 | $28,400 |
Source: Public Records
Map
Nearby Homes