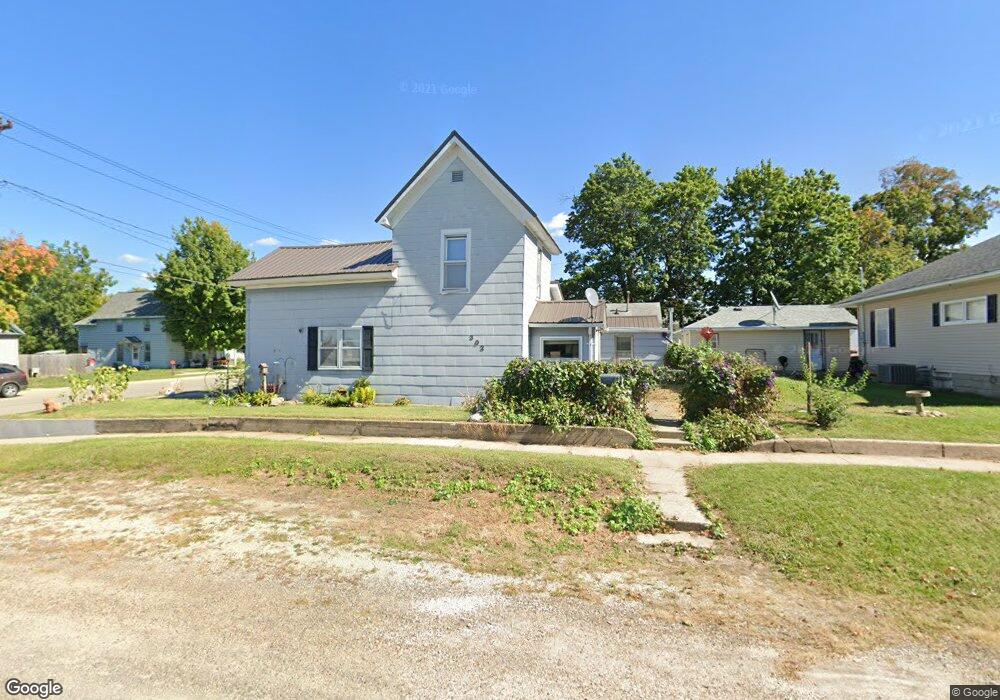
302 4th Ave Vinton, IA 52349
Estimated Value: $119,000 - $146,000
2
Beds
2
Baths
1,226
Sq Ft
$107/Sq Ft
Est. Value
About This Home
This home is located at 302 4th Ave, Vinton, IA 52349 and is currently estimated at $130,960, approximately $106 per square foot. 302 4th Ave is a home located in Benton County with nearby schools including Tilford Elementary School, Vinton-Shellsburg Middle School, and Vinton-Shellsburg High School.
Ownership History
Date
Name
Owned For
Owner Type
Purchase Details
Closed on
Aug 29, 2016
Sold by
Stein Brett and Stein Jaime Eileen
Bought by
Brown Andrew P and Brown Lola L
Current Estimated Value
Home Financials for this Owner
Home Financials are based on the most recent Mortgage that was taken out on this home.
Original Mortgage
$51,000
Outstanding Balance
$40,692
Interest Rate
3.48%
Mortgage Type
New Conventional
Estimated Equity
$90,268
Create a Home Valuation Report for This Property
The Home Valuation Report is an in-depth analysis detailing your home's value as well as a comparison with similar homes in the area
Home Values in the Area
Average Home Value in this Area
Purchase History
| Date | Buyer | Sale Price | Title Company |
|---|---|---|---|
| Brown Andrew P | -- | None Available |
Source: Public Records
Mortgage History
| Date | Status | Borrower | Loan Amount |
|---|---|---|---|
| Open | Brown Andrew P | $51,000 |
Source: Public Records
Tax History
| Year | Tax Paid | Tax Assessment Tax Assessment Total Assessment is a certain percentage of the fair market value that is determined by local assessors to be the total taxable value of land and additions on the property. | Land | Improvement |
|---|---|---|---|---|
| 2025 | $1,706 | $110,400 | $10,300 | $100,100 |
| 2024 | $1,706 | $101,300 | $9,900 | $91,400 |
| 2023 | $1,580 | $101,300 | $9,900 | $91,400 |
| 2022 | $1,620 | $82,300 | $7,900 | $74,400 |
| 2021 | $1,620 | $82,300 | $7,900 | $74,400 |
| 2020 | $1,526 | $81,500 | $6,600 | $74,900 |
| 2019 | $1,488 | $79,300 | $6,600 | $72,700 |
| 2018 | $1,442 | $76,400 | $6,100 | $70,300 |
| 2017 | $1,442 | $76,400 | $6,100 | $70,300 |
| 2016 | $1,352 | $0 | $0 | $0 |
| 2015 | $1,352 | $71,400 | $5,700 | $65,700 |
| 2014 | $1,326 | $70,000 | $0 | $0 |
Source: Public Records
Map
Nearby Homes
Your Personal Tour Guide
Ask me questions while you tour the home.