A
Seller's Agent in 2018
Agent Out of Area
Out of Area Office
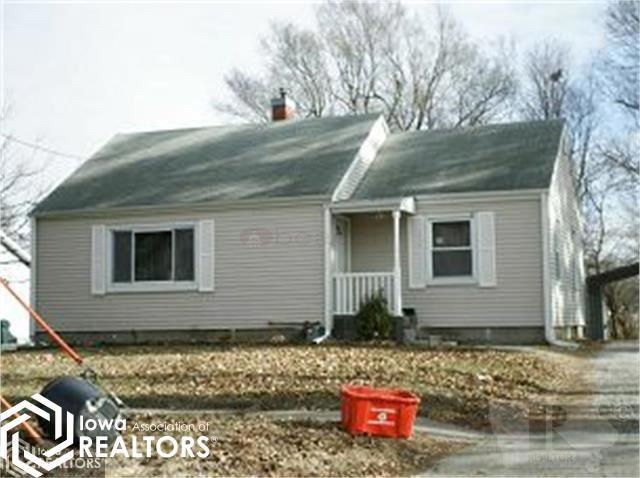

Estimated Value: $95,000 - $144,000
MLS purposes only
Last Agent to Sell the Property
Agent Out of Area
Out of Area Office Listed on: 05/20/2018
We collect this data history from publicly available records. To have your information removed, we recommend requesting removal directly through your county’s website.
We collect this data history from publicly available records. To have your information removed, we recommend requesting removal directly through your county’s website.
| Date | Buyer | Sale Price | Title Company |
|---|---|---|---|
| $68,000 | -- | ||
| -- | -- |
We collect this data history from publicly available records. To have your information removed, we recommend requesting removal directly through your county’s website.
| Date | Status | Borrower | Loan Amount |
|---|---|---|---|
| Open | $64,667 | ||
| Previous Owner | $66,721 |
We collect this data history from publicly available records. To have your information removed, we recommend requesting removal directly through your county’s website.
| Date | Event | Price | List to Sale | Price per Sq Ft | Prior Sale |
|---|---|---|---|---|---|
| 06/19/2018 06/19/18 | Sold | $65,000 | 0.0% | $61 / Sq Ft | |
| 05/23/2018 05/23/18 | Pending | -- | -- | -- | |
| 05/20/2018 05/20/18 | For Sale | $65,000 | +8.3% | $61 / Sq Ft | |
| 05/01/2012 05/01/12 | Sold | $60,000 | -19.9% | $57 / Sq Ft | View Prior Sale |
| 03/20/2012 03/20/12 | Pending | -- | -- | -- | |
| 11/04/2011 11/04/11 | For Sale | $74,900 | -- | $71 / Sq Ft |
We collect this data history from publicly available records. To have your information removed, we recommend requesting removal directly through your county’s website.
| Year | Tax Paid | Tax Assessment Tax Assessment Total Assessment is a certain percentage of the fair market value that is determined by local assessors to be the total taxable value of land and additions on the property. | Land | Improvement |
|---|---|---|---|---|
| 2025 | $1,962 | $114,190 | $22,050 | $92,140 |
| 2024 | $1,962 | $103,560 | $22,050 | $81,510 |
| 2023 | $1,950 | $103,560 | $22,050 | $81,510 |
| 2022 | $1,956 | $89,200 | $22,050 | $67,150 |
| 2021 | $1,456 | $87,930 | $22,050 | $65,880 |
| 2020 | $1,456 | $70,640 | $18,730 | $51,910 |
| 2019 | $1,270 | $61,150 | $0 | $0 |
| 2018 | $1,270 | $61,150 | $0 | $0 |
| 2017 | $1,272 | $61,150 | $0 | $0 |
| 2016 | $1,272 | $61,150 | $0 | $0 |
| 2015 | $1,236 | $59,990 | $0 | $0 |
| 2014 | $1,164 | $59,990 | $0 | $0 |
A
Seller's Agent in 2018
Agent Out of Area
Out of Area Office

Buyer's Agent in 2018
Caren Clevenger
Iowa Realty Co., Inc
(641) 792-5656
95 in this area
184 Total Sales
K
Seller's Agent in 2012
Koni Bunse
Advantage Real Estate
G
Buyer's Agent in 2012
Geri Doyle
Iowa Realty Newton
Source: NoCoast MLS
MLS Number: NOC5460614
APN: 08-34-276-021
Disclaimer: Certain information contained herein is derived from information provided by parties other than Homes.com. All information provided is deemed reliable, but is not guaranteed to be accurate and should be independently verified.
![]() All data is obtained from various sources and may not have been verified by broker or MLS GRID. Supplied Open House Information is subject to change without notice. All information should be independently reviewed and verified for accuracy. Properties may or may not be listed by the office/agent presenting the information. Some IDX listings have been excluded from this website. IDX information is provided exclusively for personal, non-commercial use, and may not be used for any purpose other than to identify prospective properties consumers may be interested in purchasing.
All data is obtained from various sources and may not have been verified by broker or MLS GRID. Supplied Open House Information is subject to change without notice. All information should be independently reviewed and verified for accuracy. Properties may or may not be listed by the office/agent presenting the information. Some IDX listings have been excluded from this website. IDX information is provided exclusively for personal, non-commercial use, and may not be used for any purpose other than to identify prospective properties consumers may be interested in purchasing.
Information is deemed reliable but not guaranteed.
Listings courtesy of NoCoast MLS as distributed by MLS GRID.
Based on information submitted to the MLS GRID
Ask me questions while you tour the home.